Figure 3 of
Ding, Mol Vis 2018; 24:252-260.
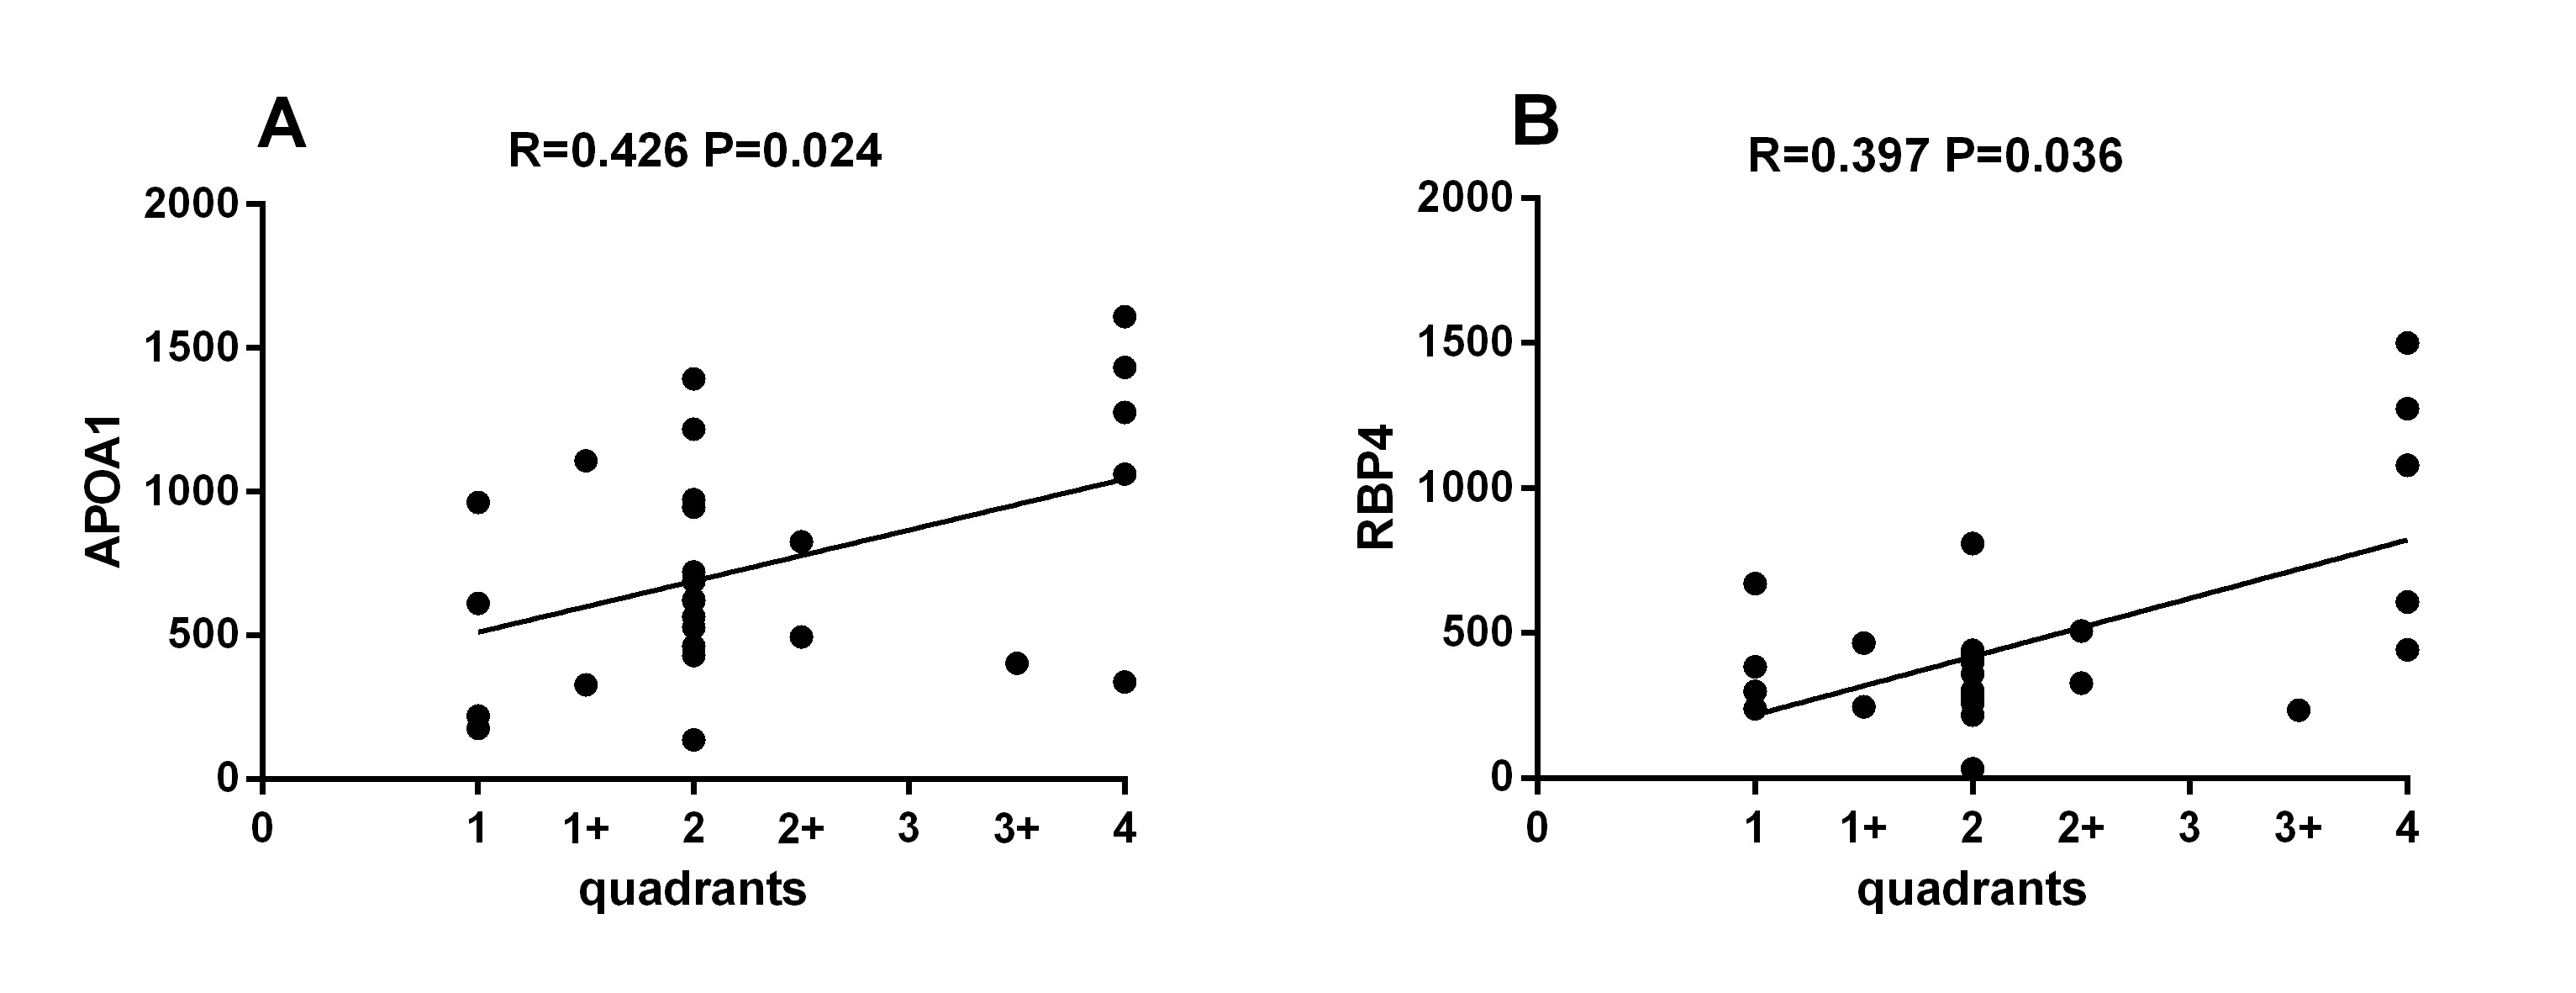
Figure 3.
The relationship between the concentrations of APOA1 (R=0.426, p=0.024) and RBP4 (R=0.397, p=0.036) in the vitreous and the extent of retinal detachment in patients with RRD.
 Figure 3 of
Ding, Mol Vis 2018; 24:252-260.
Figure 3 of
Ding, Mol Vis 2018; 24:252-260.