Figure 1. Scatter plots of concentration of APOA1 and RBP4. Scatter plots of concentrations of APOA1 (A) and RBP4 (B). The difference in the APOA1 and RBP4 concentrations between groups was statistically significant (p<0.001). Pairwise comparison
among groups also showed that the difference in the APOA1 and RBP4 concentrations was statistically significant (p<0.05).
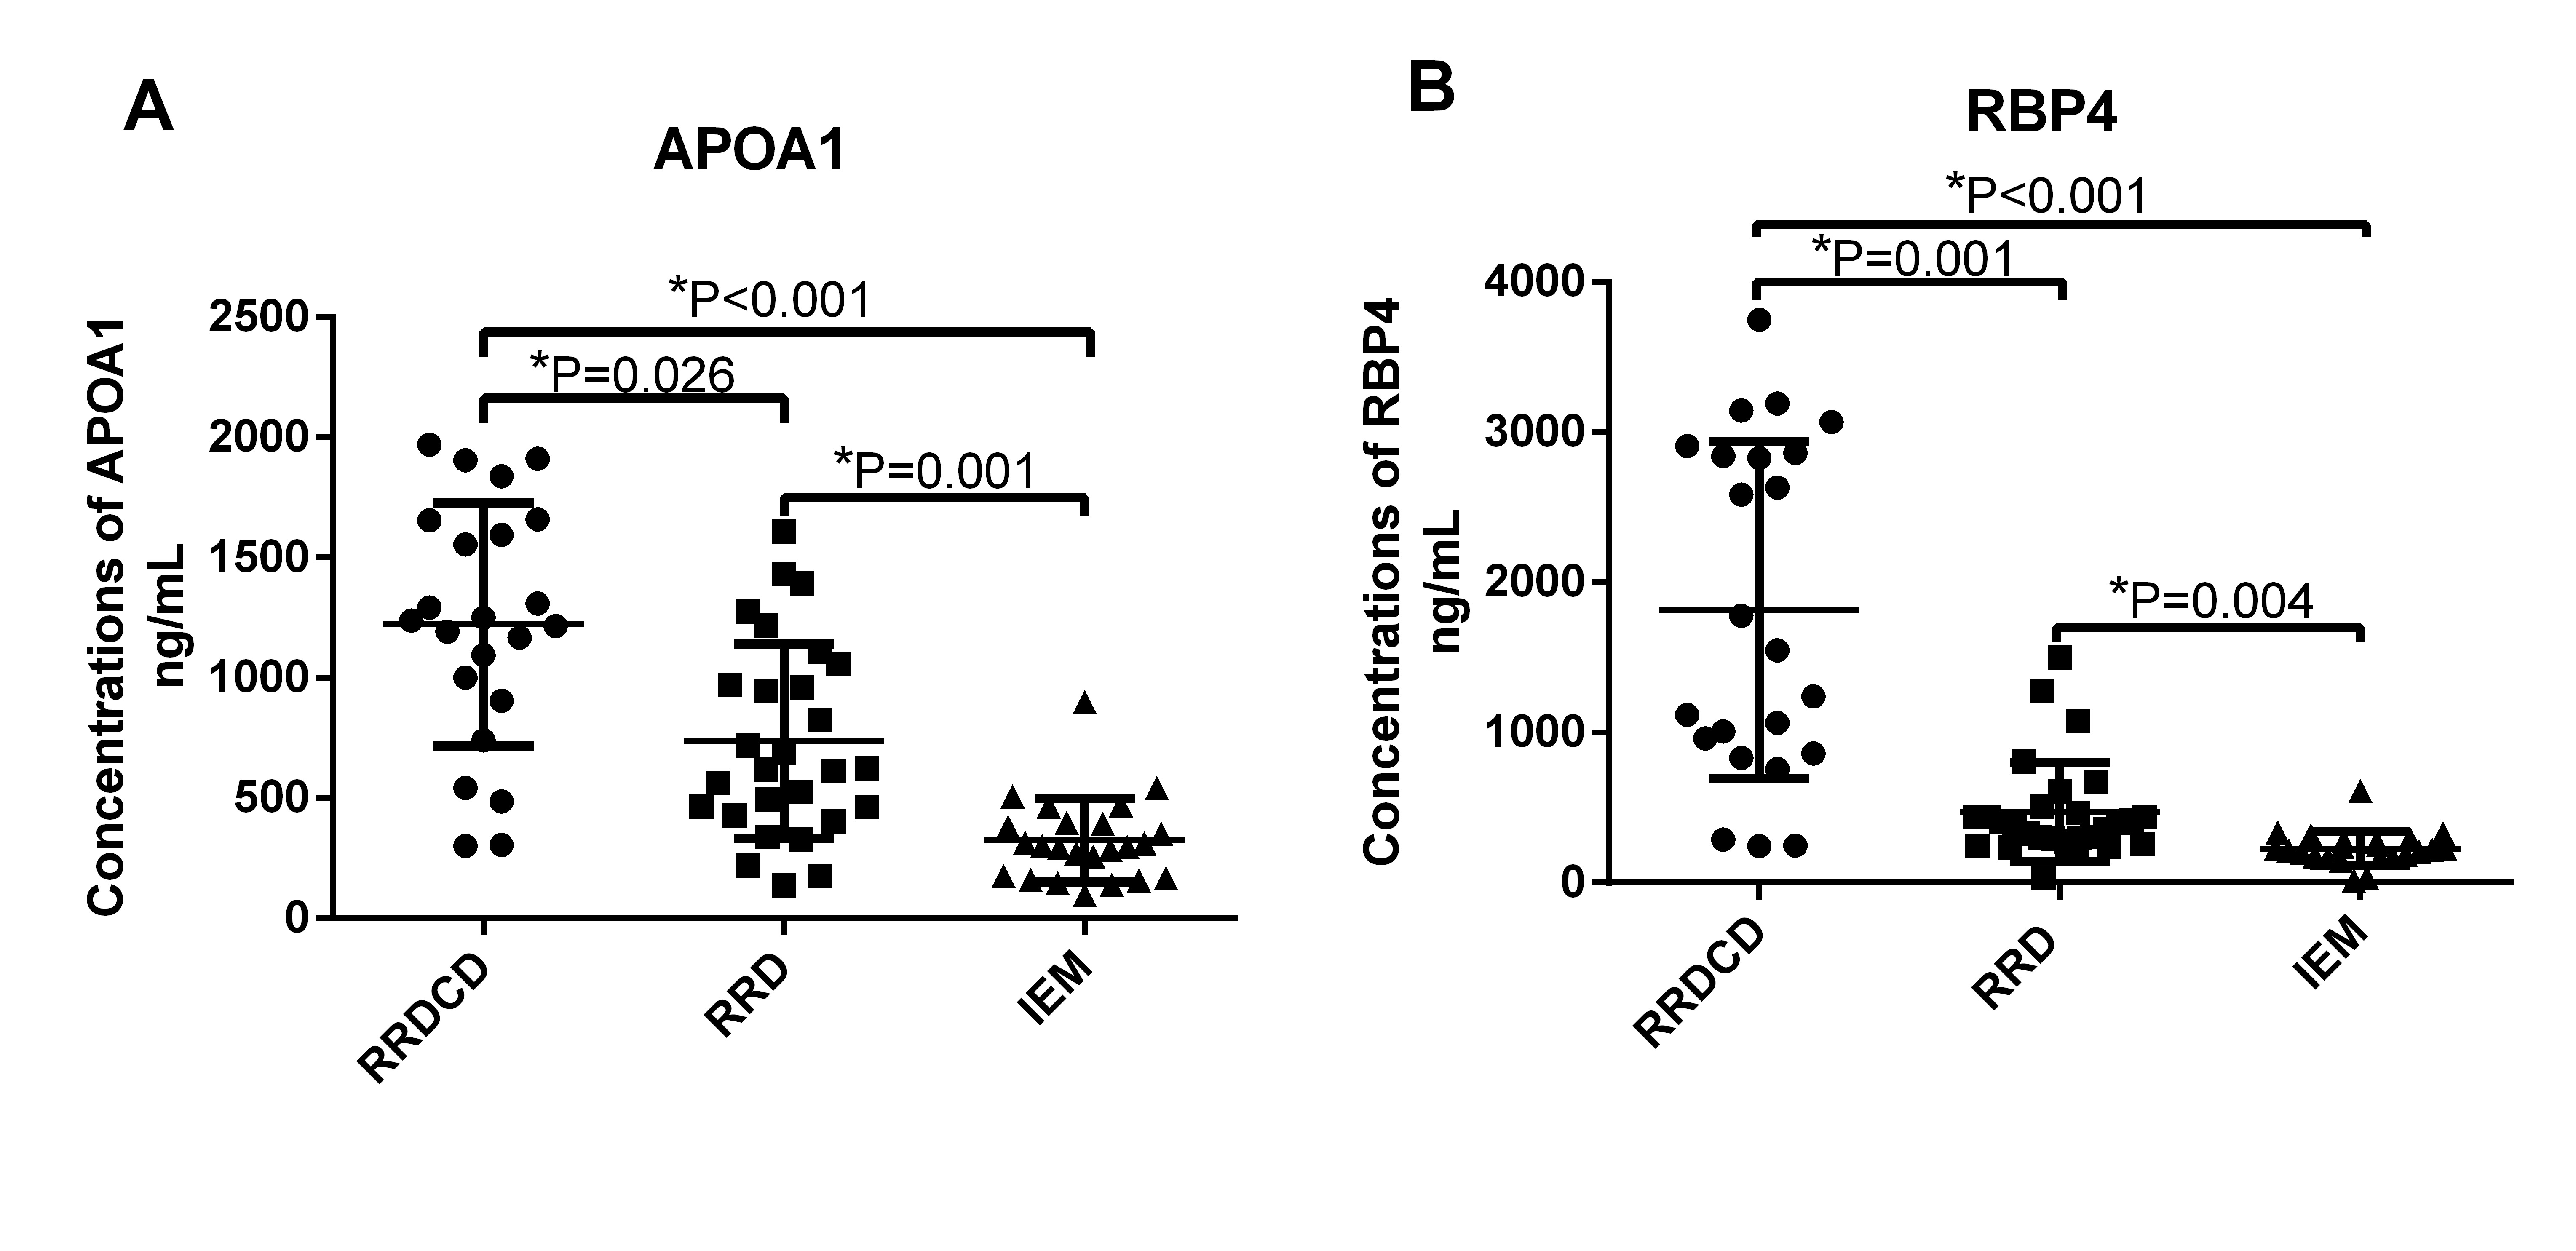
 Figure 1 of
Ding, Mol Vis 2018; 24:252-260.
Figure 1 of
Ding, Mol Vis 2018; 24:252-260.