Figure 7. VEGFR-2 intensity of the choroid layer of the eye. Data expressed as median ± standard error of the mean (SEM; n=6). The response
is the same as in the ganglion cell layer (GCL) as VEGFR-2 is suppressed by bevacizumab (BEV) statistically significantly
(** p<0.01 and *** p<0.001). IR = ischemia and reperfusion.
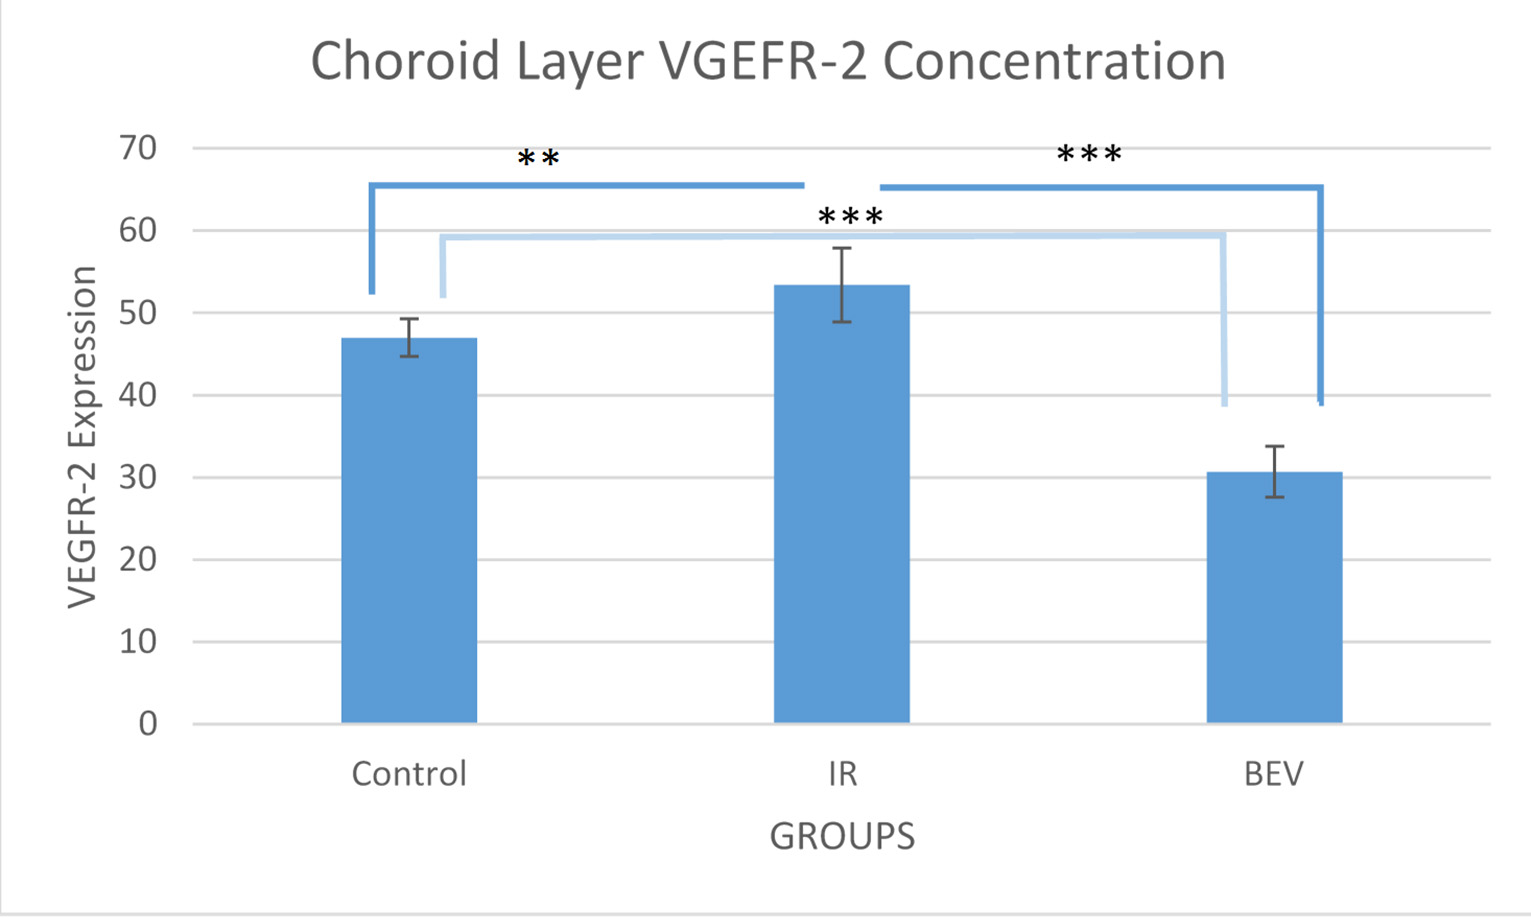
 Figure 7 of
Kohen, Mol Vis 2018; 24:239-250.
Figure 7 of
Kohen, Mol Vis 2018; 24:239-250.