Figure 6. Immunohistochemical evaluation of VEGFR-2-stained tissue samples: C, IR, and BEV. VEGFR-2 staining intensity increased in
the retina and choroid layers of the ischemia and reperfusion (IR) group, but this result was decreased in the bevacizumab
(BEV) group. Stars indicate the choroid layer. C = control. Scale bar: 100 µm.
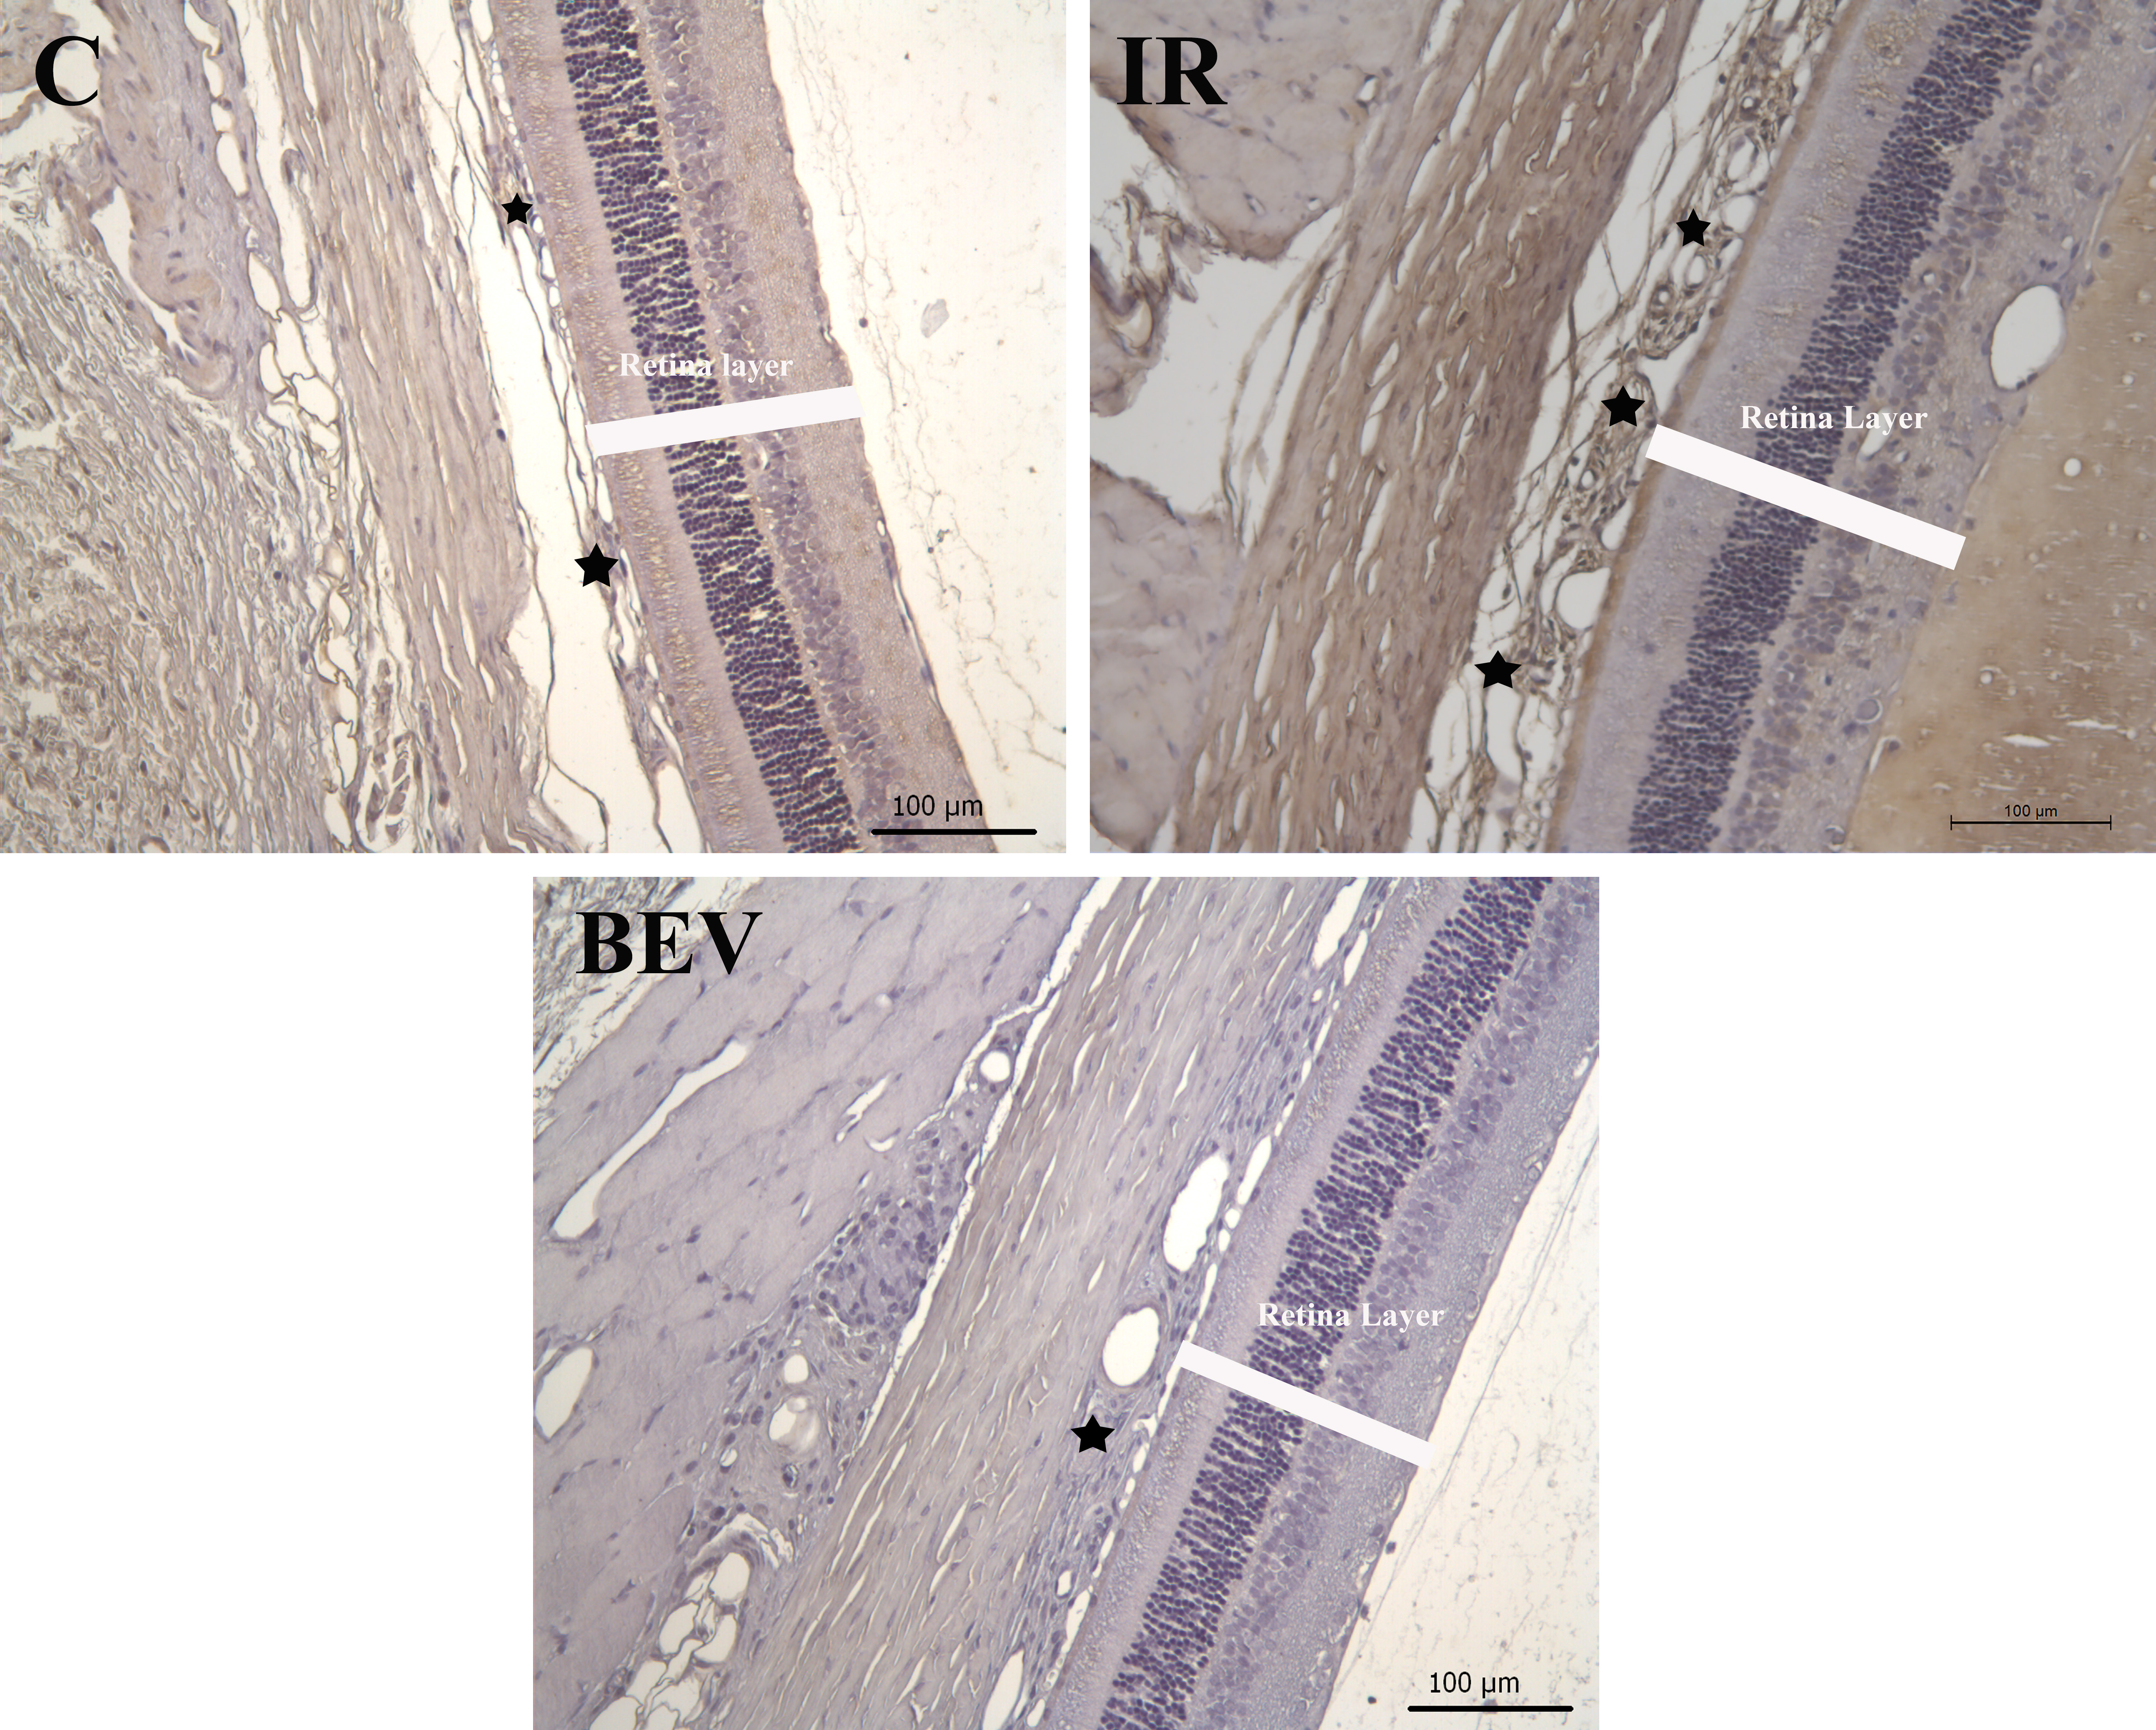
 Figure 6 of
Kohen, Mol Vis 2018; 24:239-250.
Figure 6 of
Kohen, Mol Vis 2018; 24:239-250.