Figure 5. VEGFR-2 staining intensity of the RGC layer. There are two important points in this graph. The first one is the high VEGF
response to the ischemia and reperfusion and its significant suppression by bevacizumab (** p<0.01 and *** p<0.001). Data
expressed as median ± standard error of the mean (SEM; n=6). BEV = bevacizumab; IR = ischemia-reperfusion.
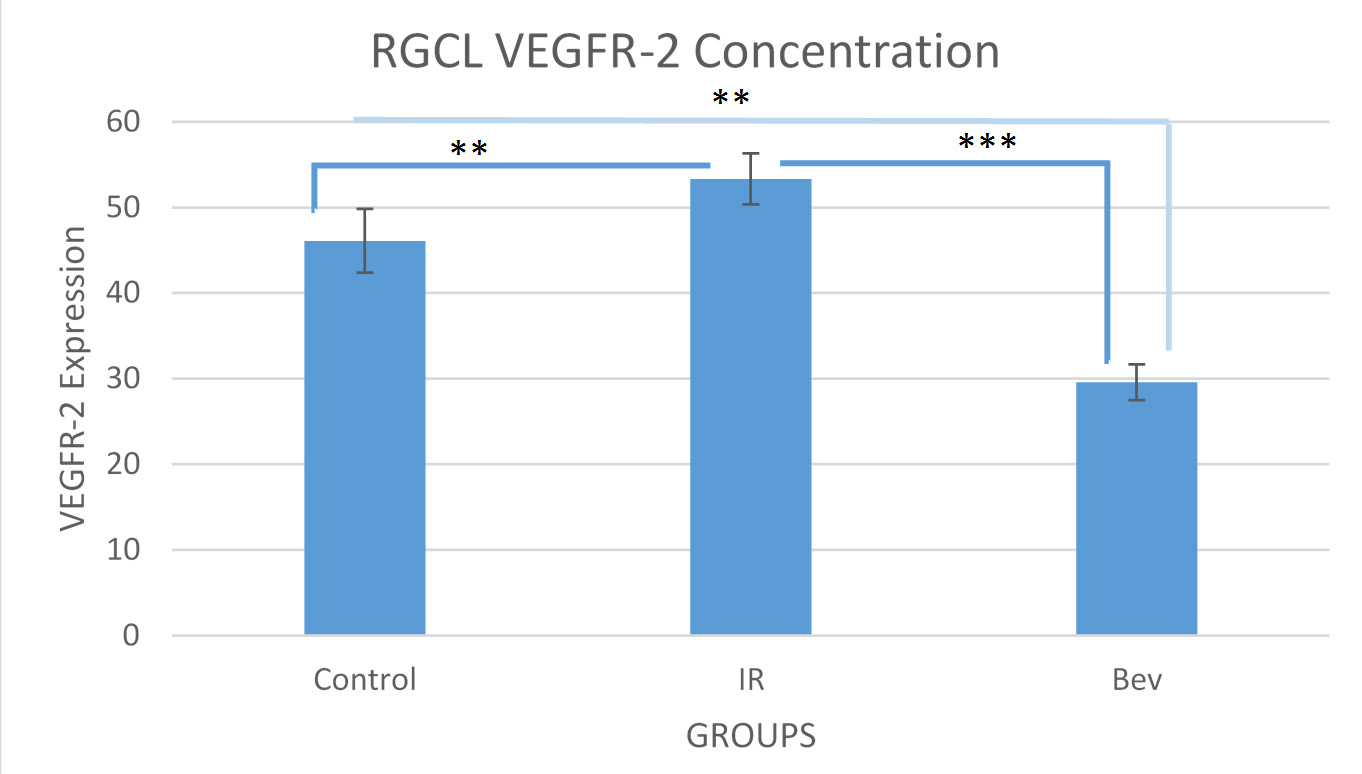
 Figure 5 of
Kohen, Mol Vis 2018; 24:239-250.
Figure 5 of
Kohen, Mol Vis 2018; 24:239-250.