Figure 4. Immunohistochemical evaluation of TUNEL-stained tissue samples: control, IR, and BEV. The black arrows point out the apoptotic
ganglion cells in the retina layers. Scale bar: 50 µm. C = control; IR = ischemia and reperfusion; BEV = bevacizumab.
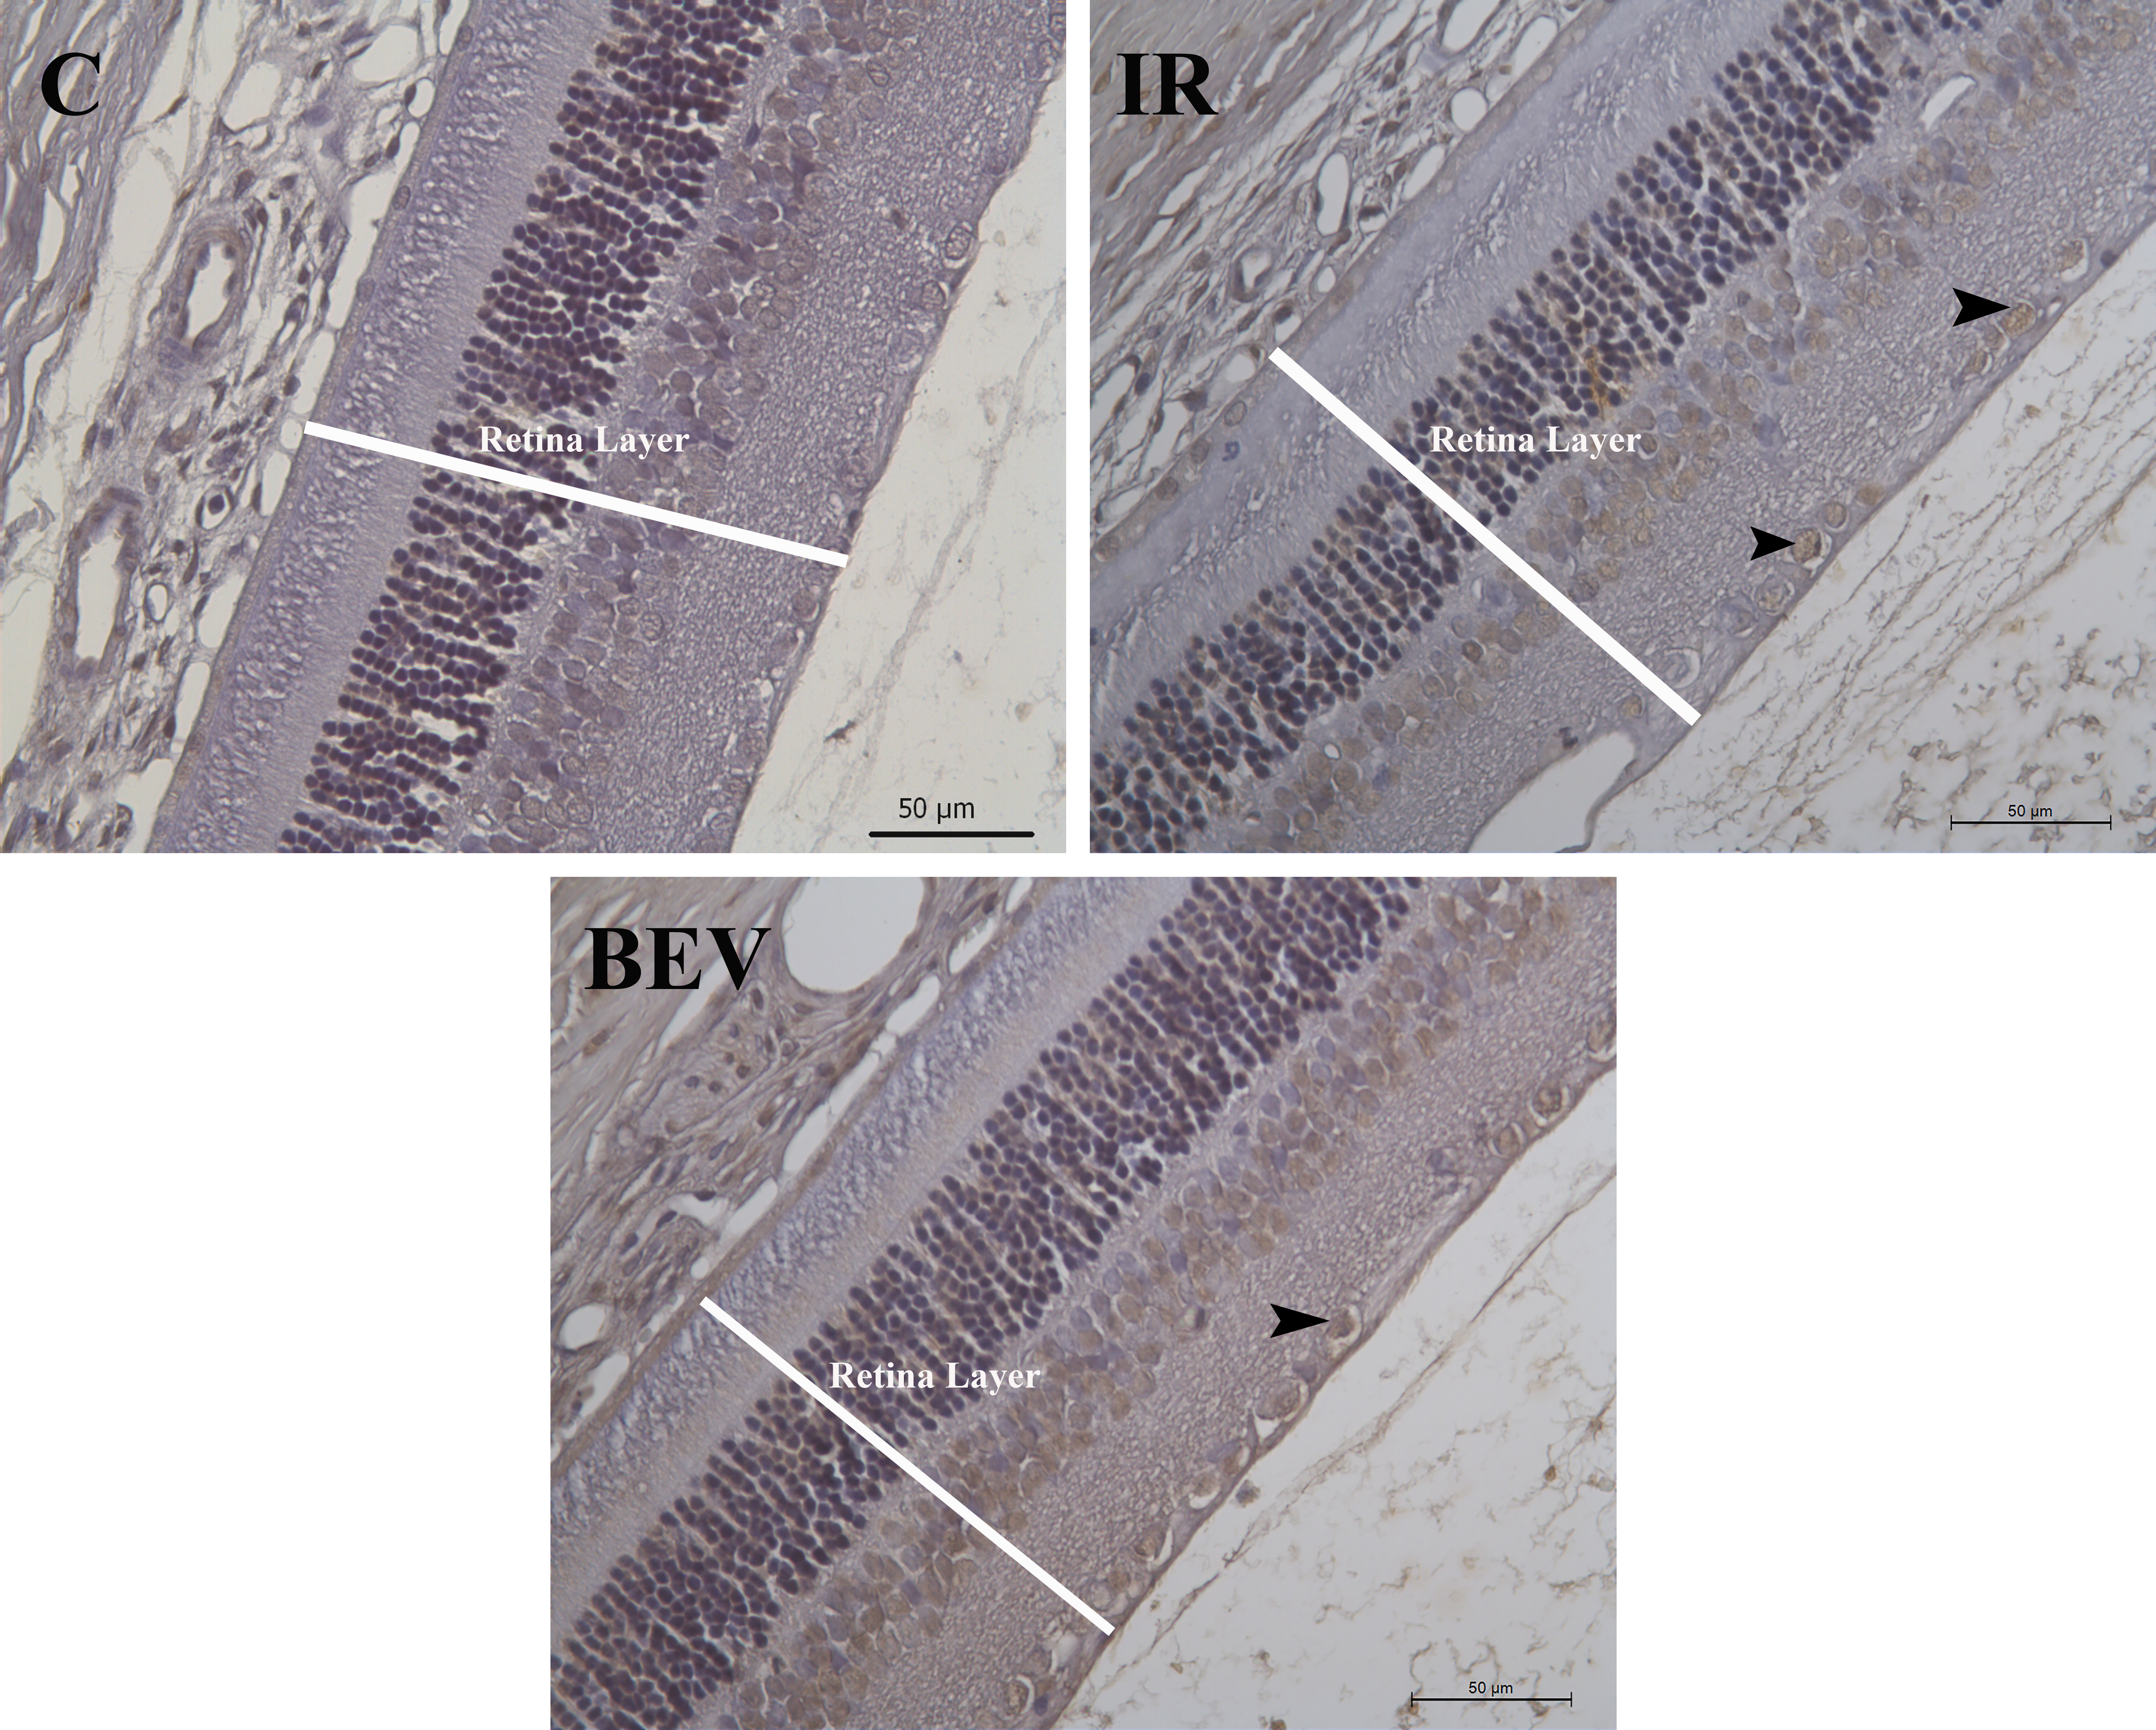
 Figure 4 of
Kohen, Mol Vis 2018; 24:239-250.
Figure 4 of
Kohen, Mol Vis 2018; 24:239-250.