Figure 2. Comparison of histological cross sections of the control, IR, and BEV groups. White arrows indicate the cells at the retinal
ganglion cell layer. Staining: Hematoxylin and eosin. Scale bar: 50 µm. C = control; IR = ischemia and reperfusion; BEV =
bevacizumab.
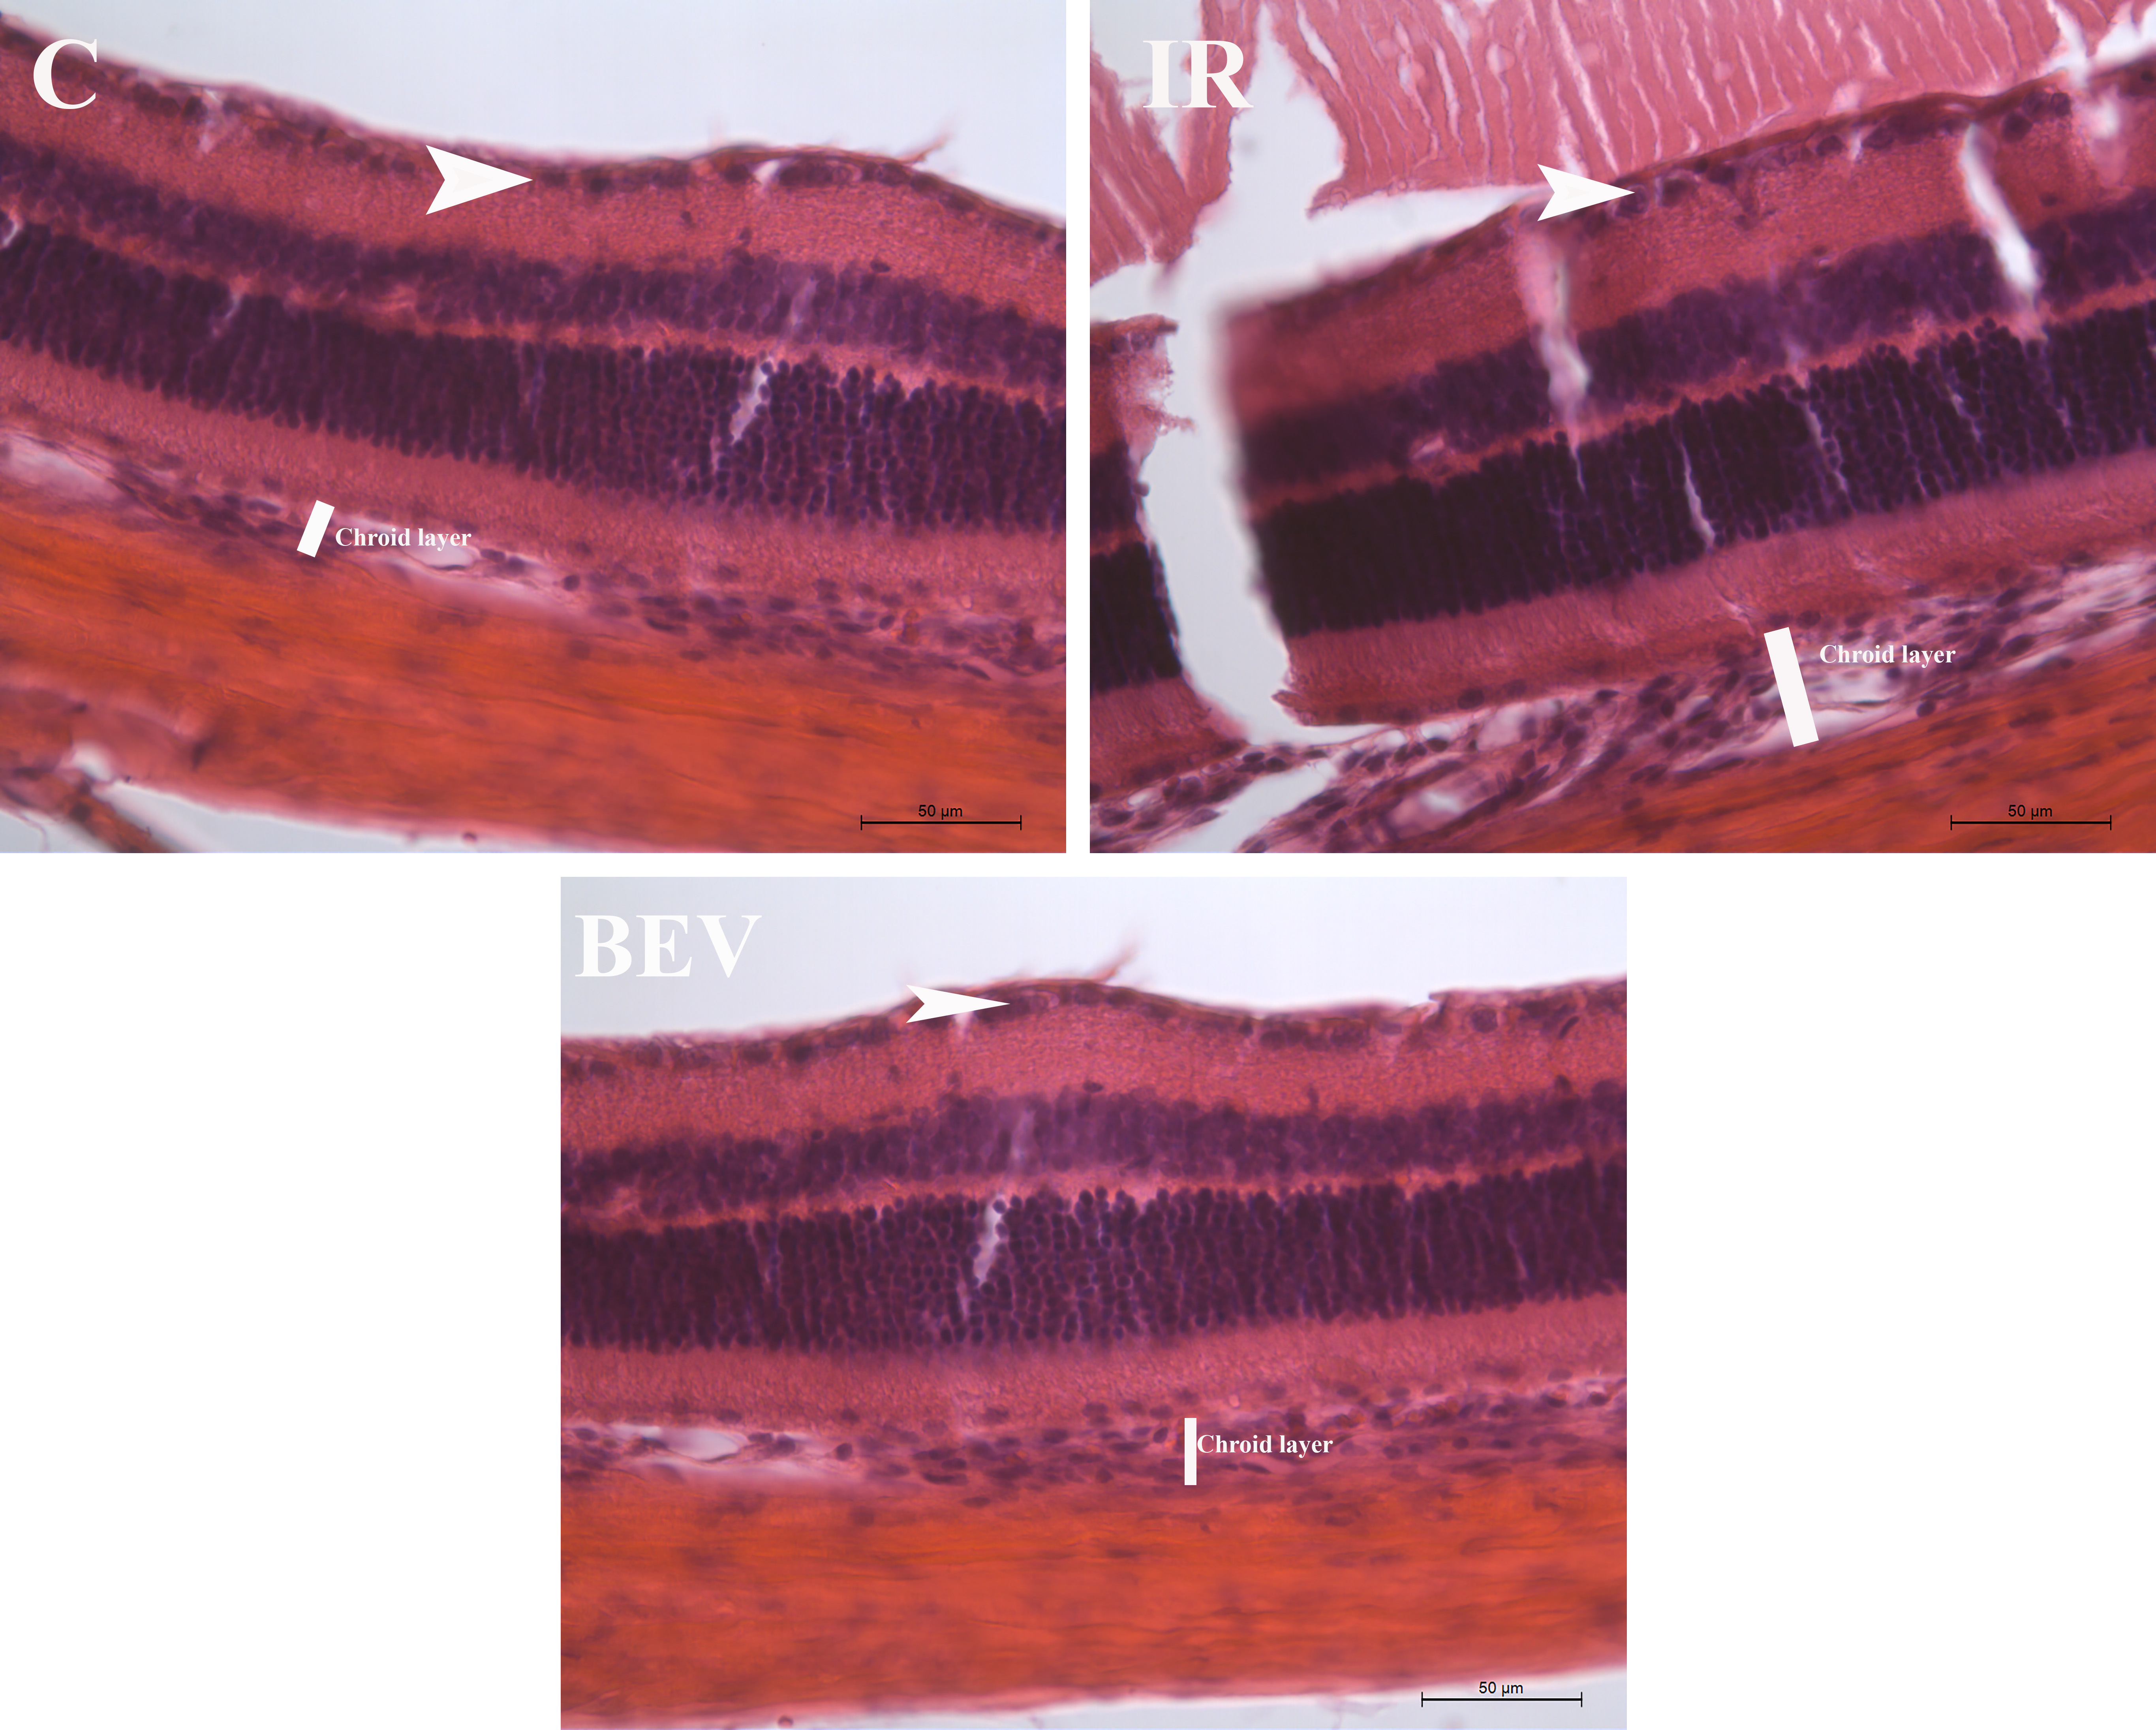
 Figure 2 of
Kohen, Mol Vis 2018; 24:239-250.
Figure 2 of
Kohen, Mol Vis 2018; 24:239-250.