Figure 6. Structural and dynamic effects of methylation on the RER sequence. A: Density plots for the major groove. B: The methylated major groove. C: The minor groove. D: The methylated minor groove widths for the methylated. The nucleotides within the CRX binding region are shown in green,
and the methylation site is indicated in magenta. The mean groove width for each groove during the simulation is indicated
as a dashed vertical line.
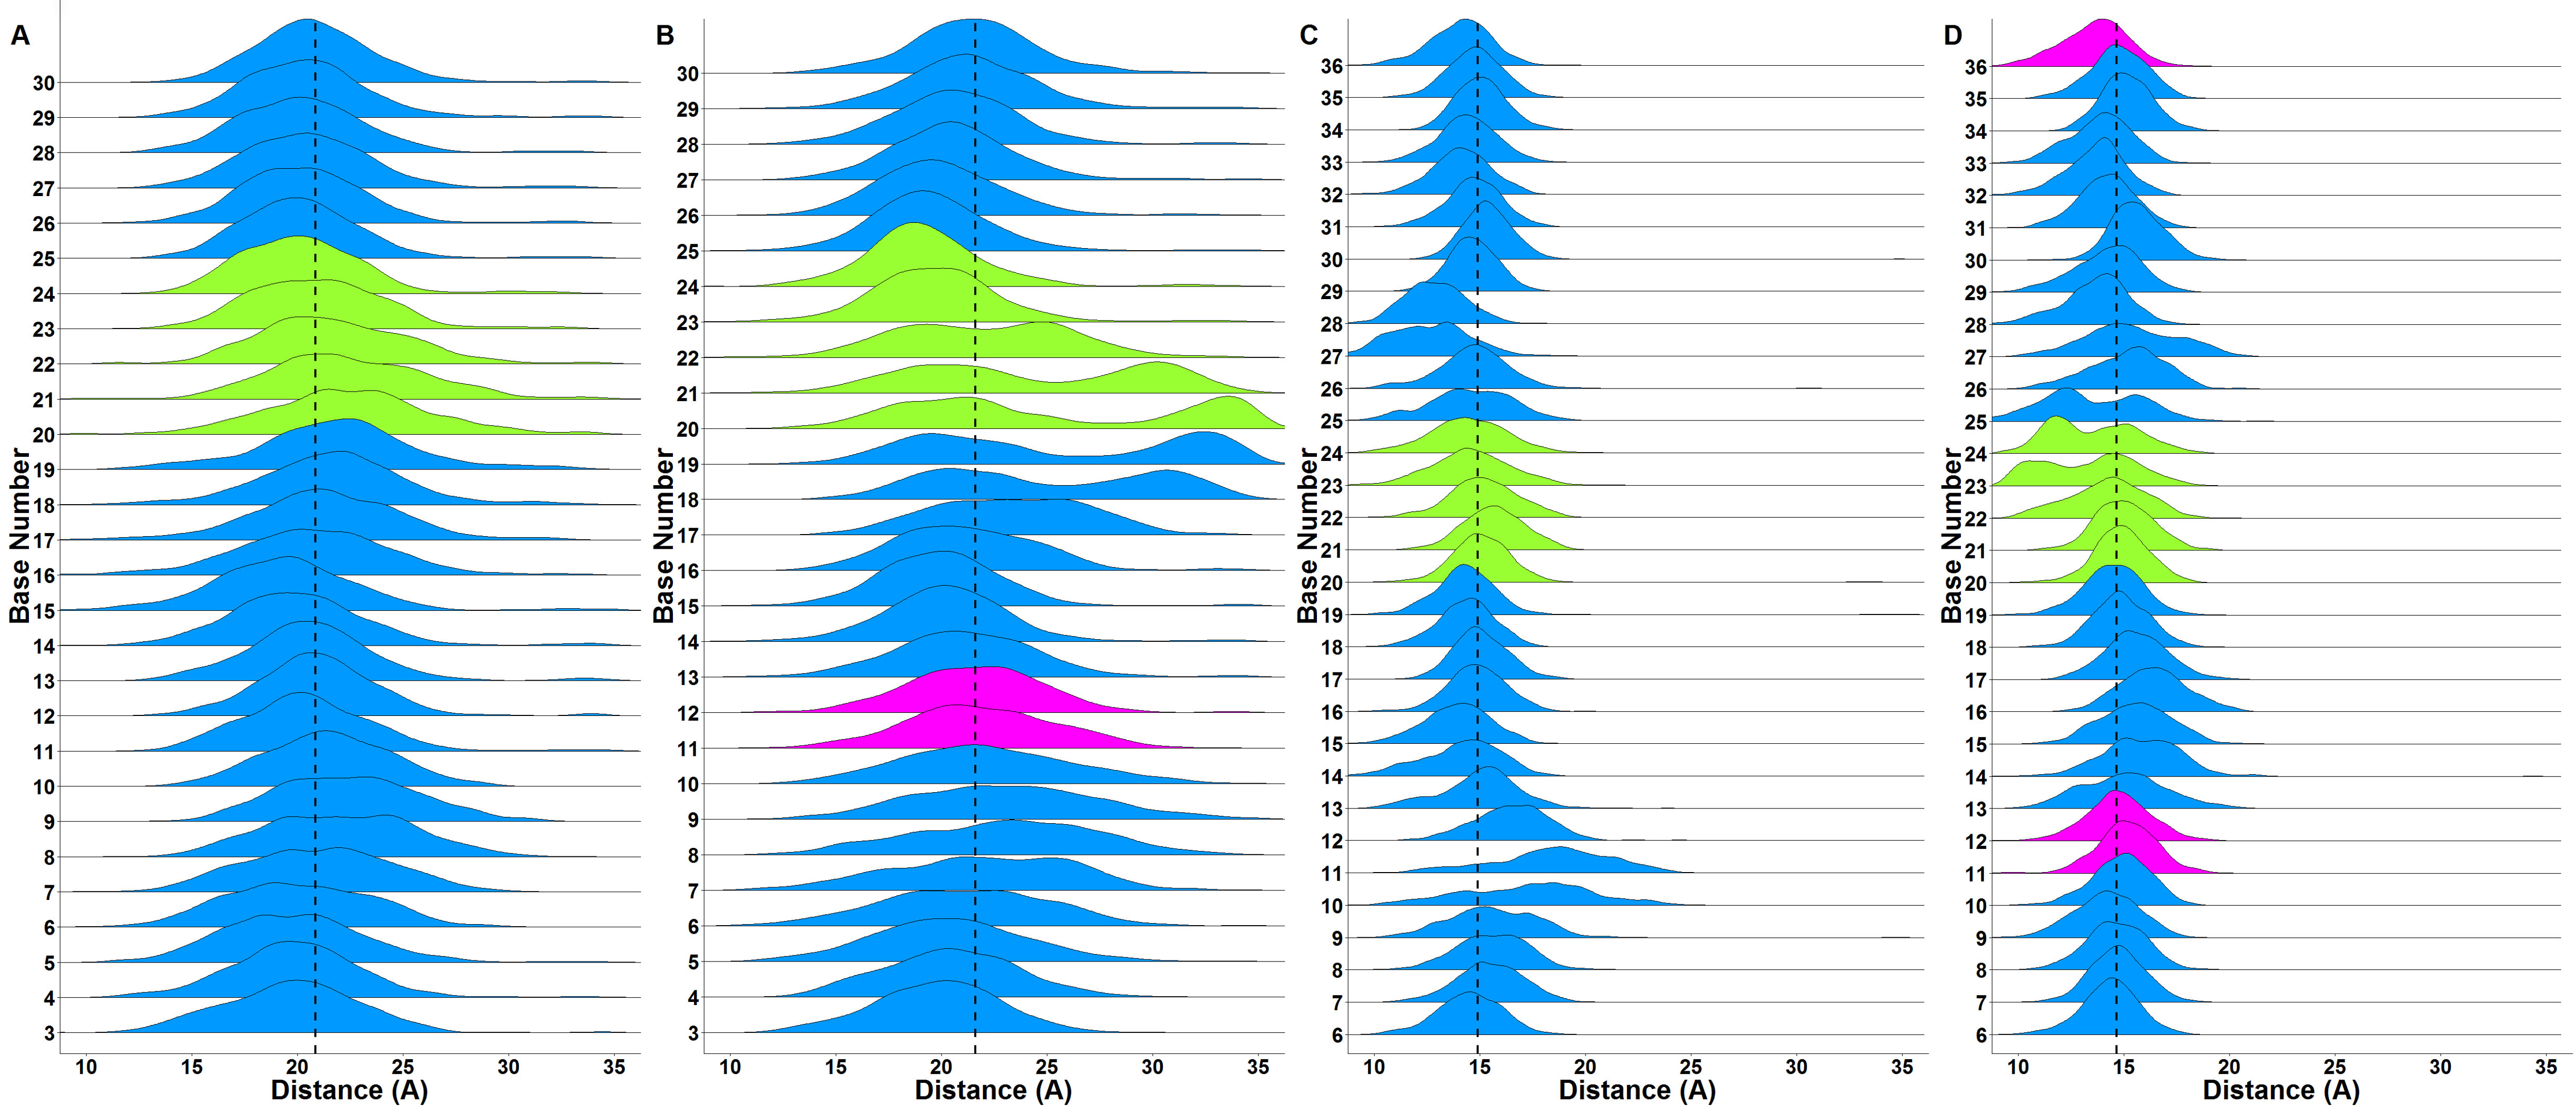
 Figure 6 of
Hossain, Mol Vis 2018; 24:218-230.
Figure 6 of
Hossain, Mol Vis 2018; 24:218-230.