Figure 2. Quantitative bisulfite pyrosequencing analysis of DNA methylation at CpG sites relative to the transcriptional start site
of (A) RHO, (B) PDE6B, (C) LINE1 retrotransposon repeats, and (D) PAX6. Data are presented as percentage methylation at the indicated genomic positions relative to the gene’s canonical transcriptional
start site (TSS) with the exception of LINE1 repeats in which the promoter CpG sites are arbitrarily labeled as positions
1–3. Error bars represent the standard error of the mean between three biological replicates of each sample (note that the
error bars are present but too small to see in panels A, C, and D). Statistical significance between the retina and the cornea at each CpG site was determined with a t test with a p value of less than 0.01. All CpG sites analyzed at all four loci were found to have a p value of less than
0.01 between the sample groups.
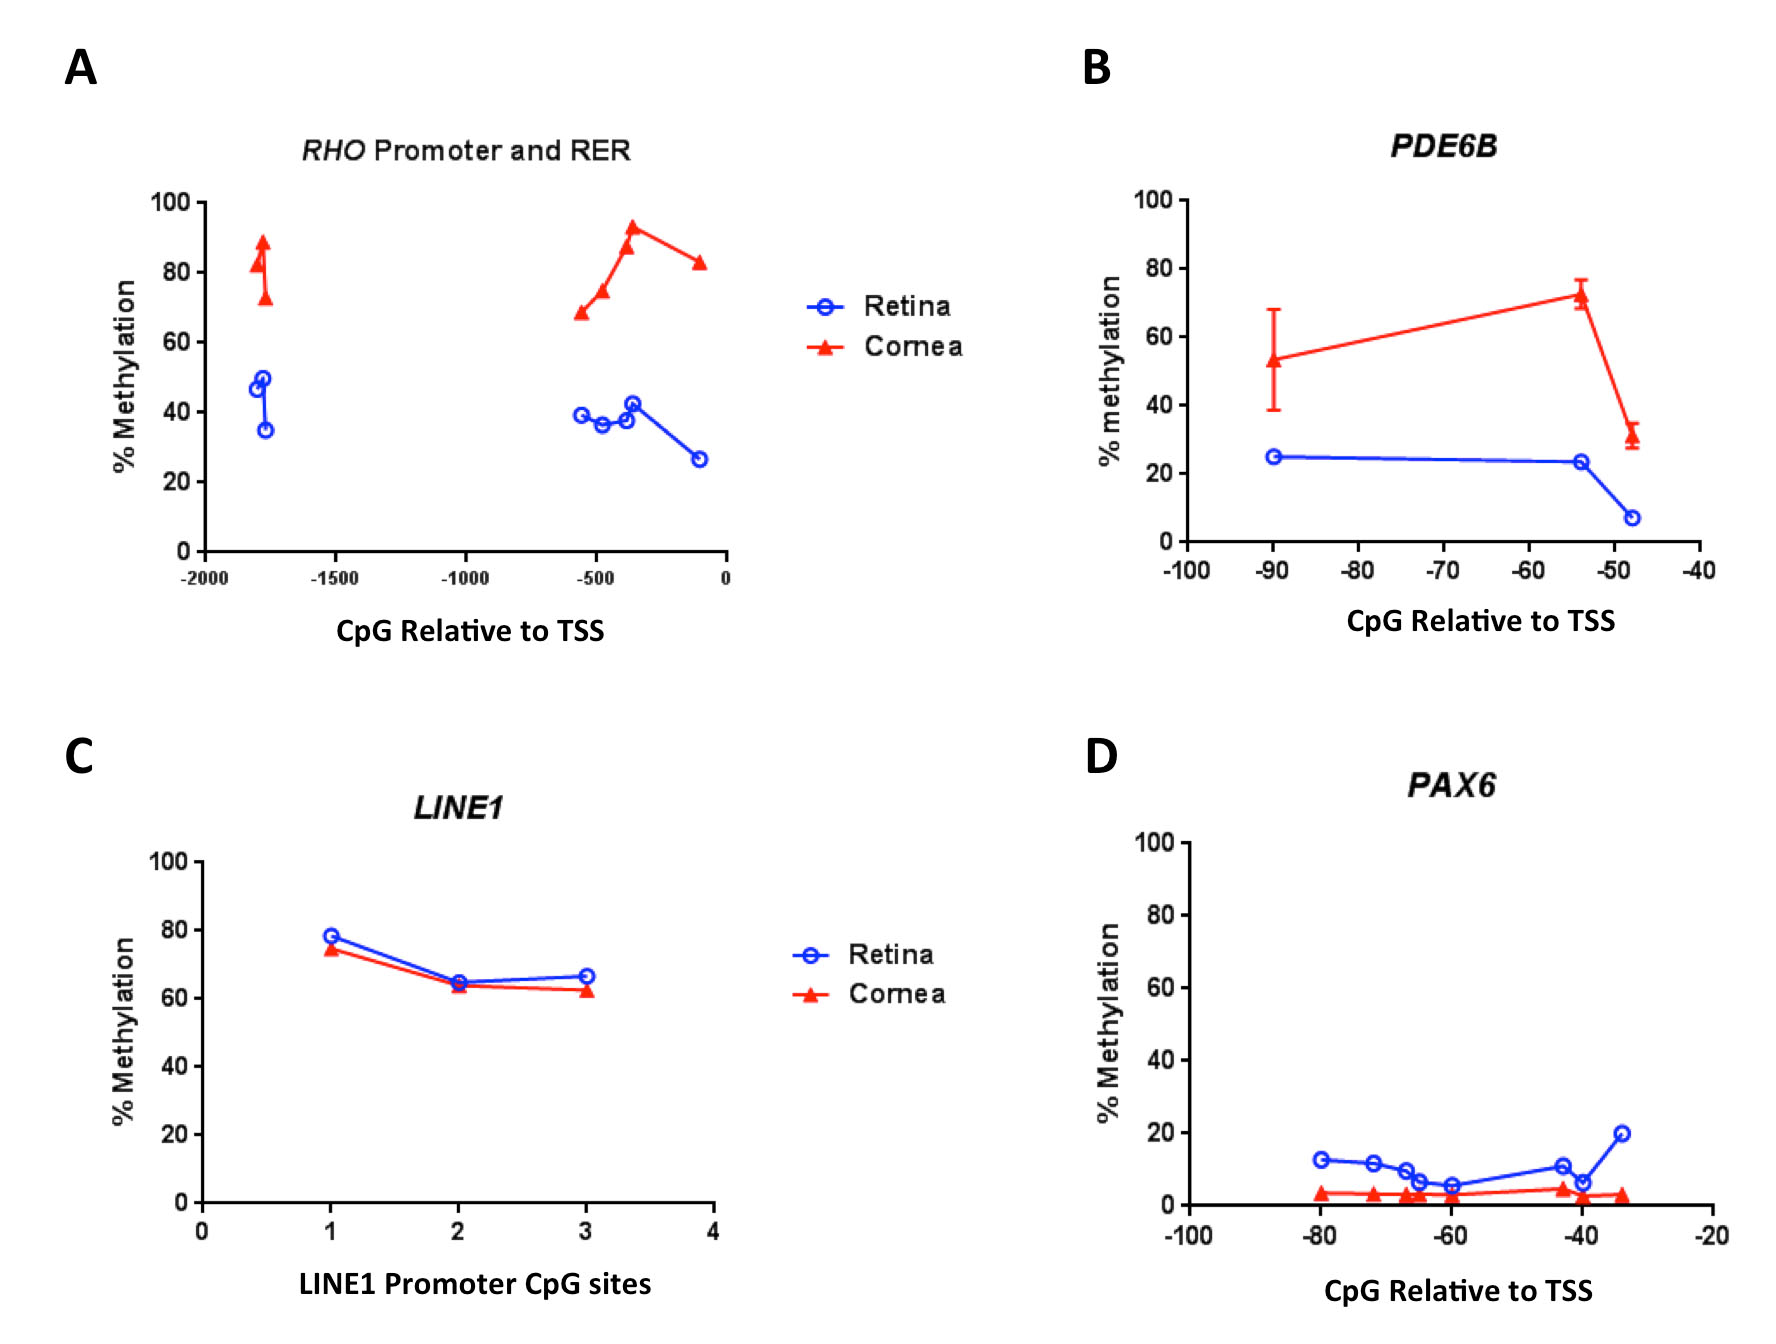
 Figure 2 of
Hossain, Mol Vis 2018; 24:218-230.
Figure 2 of
Hossain, Mol Vis 2018; 24:218-230.