Figure 5. Multivariate analysis of metabolomics data from ob/ob and wt control mouse sera and retinas. A: Principal component analysis (PCA, PC1 versus PC2) of the serum samples showed a good separation between the ob/ob (green)
and wild-type (wt) control (blue) mice along the second principal component (PC2). B: Orthogonal partial least-squares discriminant analysis (OPLS-DA) scatterplot displaying clear between-group separation along
the predictive component (tp) in serum. C: Volcano plot showing top discriminant metabolites (highest variable importance for the projection (VIP) and pcorr values)
between the ob/ob and wt control mice. Metabolites with a VIP value >1 are marked in red. Three metabolites decreased in the
ob/ob mouse serum, and 47 increased compared to the wt control mice. D: Principal component analysis of the retinal samples (PC1 versus PC2) shows no outliers but a less clear separation between
the ob/ob (green) and wt control retinal samples (blue). E: OPLS-DA scatter plot displaying clear between-group separation along the predictive component (tp). F: Volcano plot showing top discriminant metabolites (highest VIP and pcorr values) in between-group discrimination. Metabolites
with a VIP value >1 are marked in red. Ten metabolites decreased in the ob/ob mouse retinas, and 48 increased compared to
the wt control retinas. PCA, principal component analysis; PC1, first principal component; PC2, second principal component;
tp, predictive component in the OPLS-DA model; to, orthogonal component in the OPLS-DA model; VIP, variable importance for
the projection; pcorr, scaled loading values. AA, amino acids; BA, biogenic amine compounds; CC, carnitine compounds; Glu,
glutamate; LysoPC, lyso-phosphatidylcholine; PC aa, diacyl phosphatidylcholine; PC ae, acyl-alkyl phosphatidylcholine; SM,
sphingomyelin; SM(OH), hydroxy sphingomyelin.
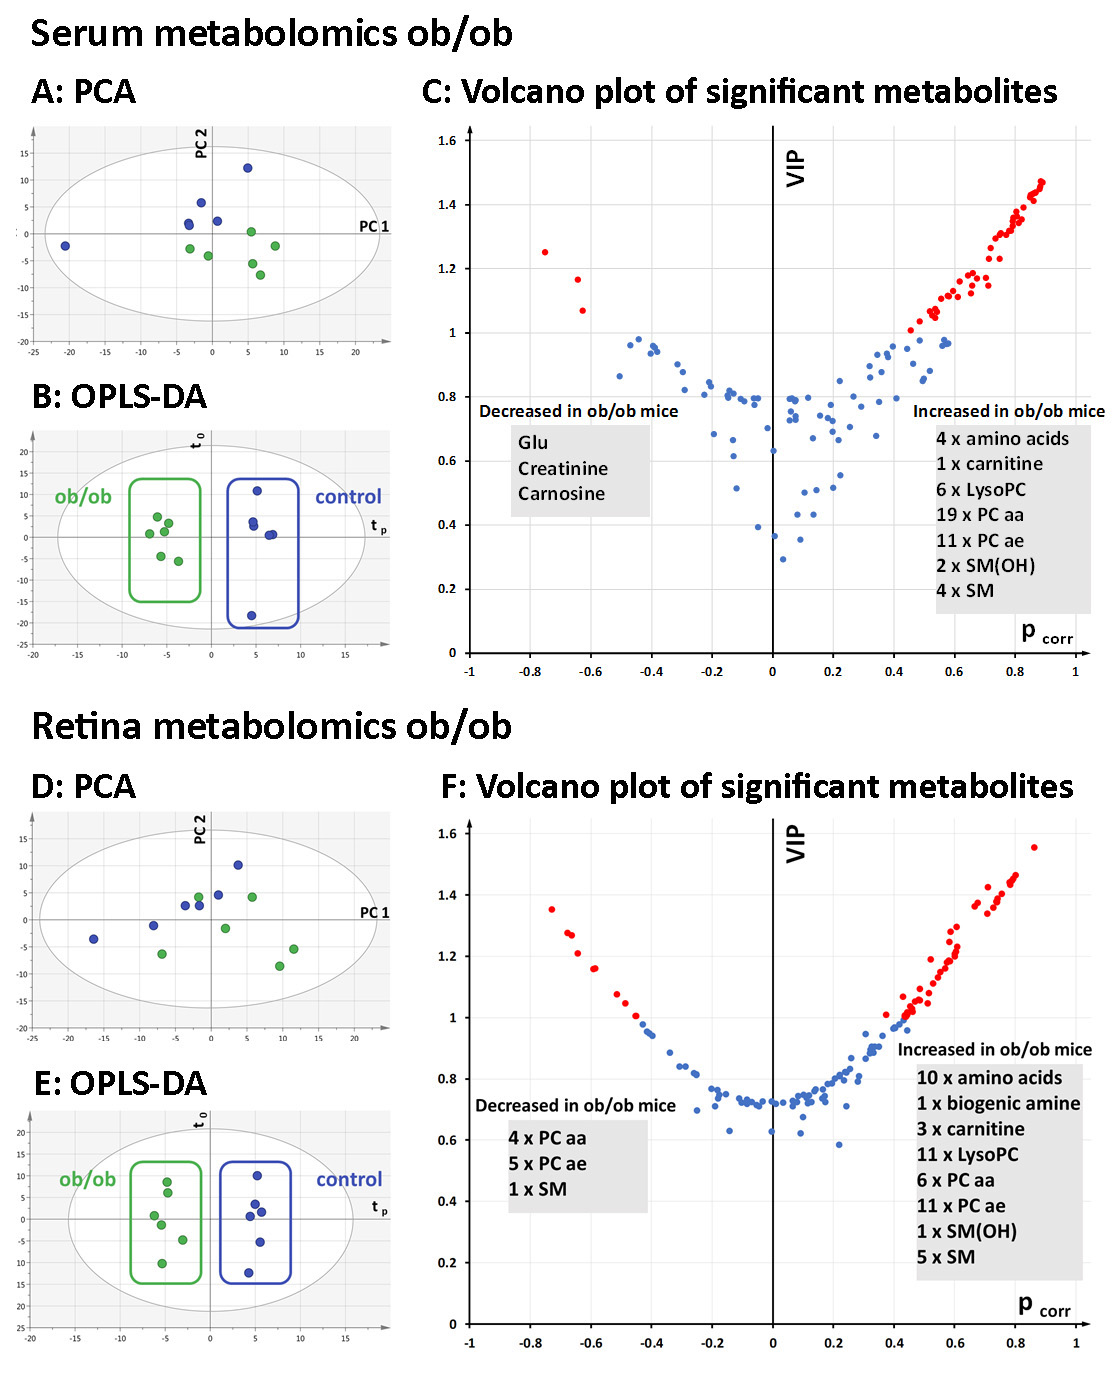
 Figure 5 of
Natoli, Mol Vis 2018; 24:201-217.
Figure 5 of
Natoli, Mol Vis 2018; 24:201-217.