Figure 3. Complement activation in ob/ob retinas. A: Statistically significantly altered gene expression of C2, Cfb, and Cfh (p<0.05, n=8–9) was detected in the ob/ob retinas compared to the wild-type (wt) control retinas, which are all involved
in complement activation. No statistically significant difference was detected in C3 gene expression between the groups (n=12). B–E: Immunohistochemistry for C3 in the wt control retinas showed no C3 expression in any of the retinal sections analyzed (B, n=8). However, C3 expression (arrowheads) was detected in several cells in the ob/ob retinas, in the outer retina (C, E) and the outer plexiform layer (OPL, D). F–N: Colocalization of C3 (green) and IBA1 (purple) was observed in the ob/ob outer retinas (F–H), the OPL (I–K) and within the outer segments (OS, L and M). Statistical analysis was performed using a Student t test. * indicates a statistical significance of p<0.05. INL, inner nuclear layer; ONL, outer nuclear layer; RPE, retinal
pigment epithelium. Scale bars = 50 µm. Error bars are displayed as standard error of the mean (SEM).
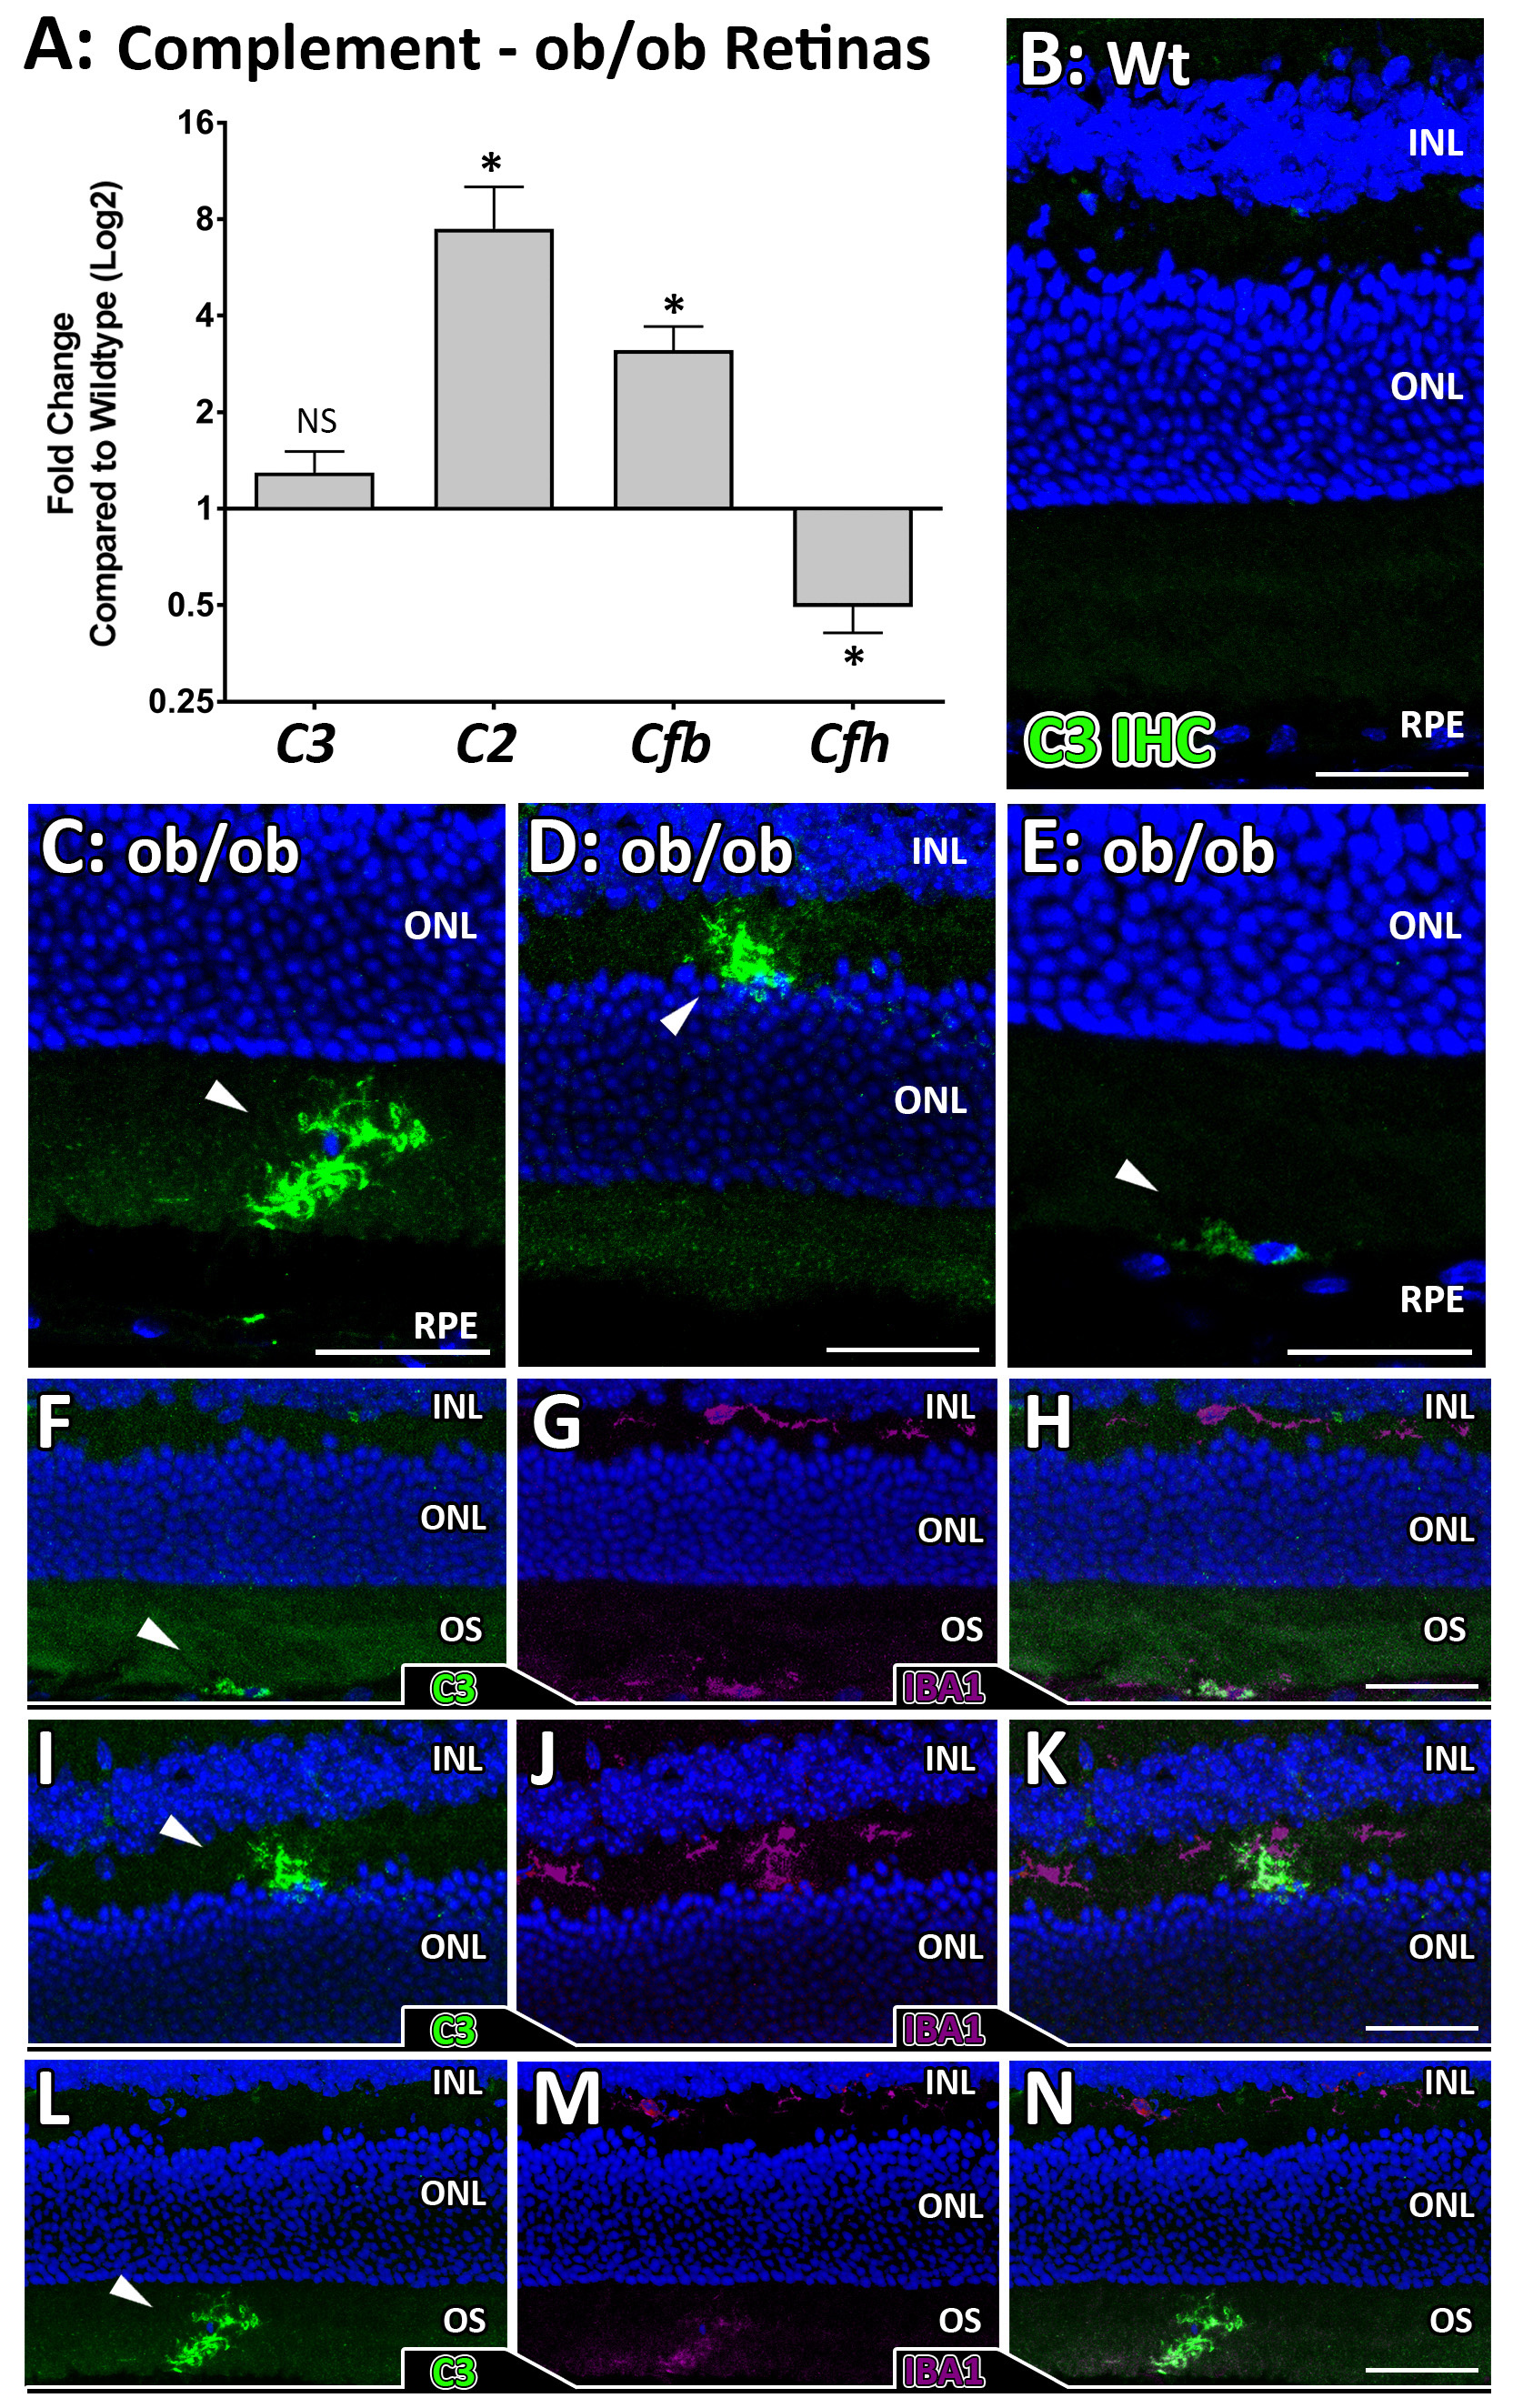
 Figure 3 of
Natoli, Mol Vis 2018; 24:201-217.
Figure 3 of
Natoli, Mol Vis 2018; 24:201-217.