Figure 1. The expression levels of type I and II IFNs in neutrophils, lymphocytes, and macrophages after zymosan stimulation. The mRNA
expression levels of type I interferons (IFNs; normalized to β-actin), including IFN-α and IFN-β, and the type II IFN IFN-γ
peaked at 8 h after stimulation in neutrophils (A), lymphocytes (B), macrophages (C), and A6(1) cells (D). The protein expression level and the band intensity of IFN-β (E and F) was also determined in neutrophils, lymphocytes, and macrophages. The data are presented as the mean ± standard error of
the mean (SEM) and represent three individual experiments with five samples. *, p<0.05; **, p<0.01; ***, p<0.001. IDV, integrated
density value.
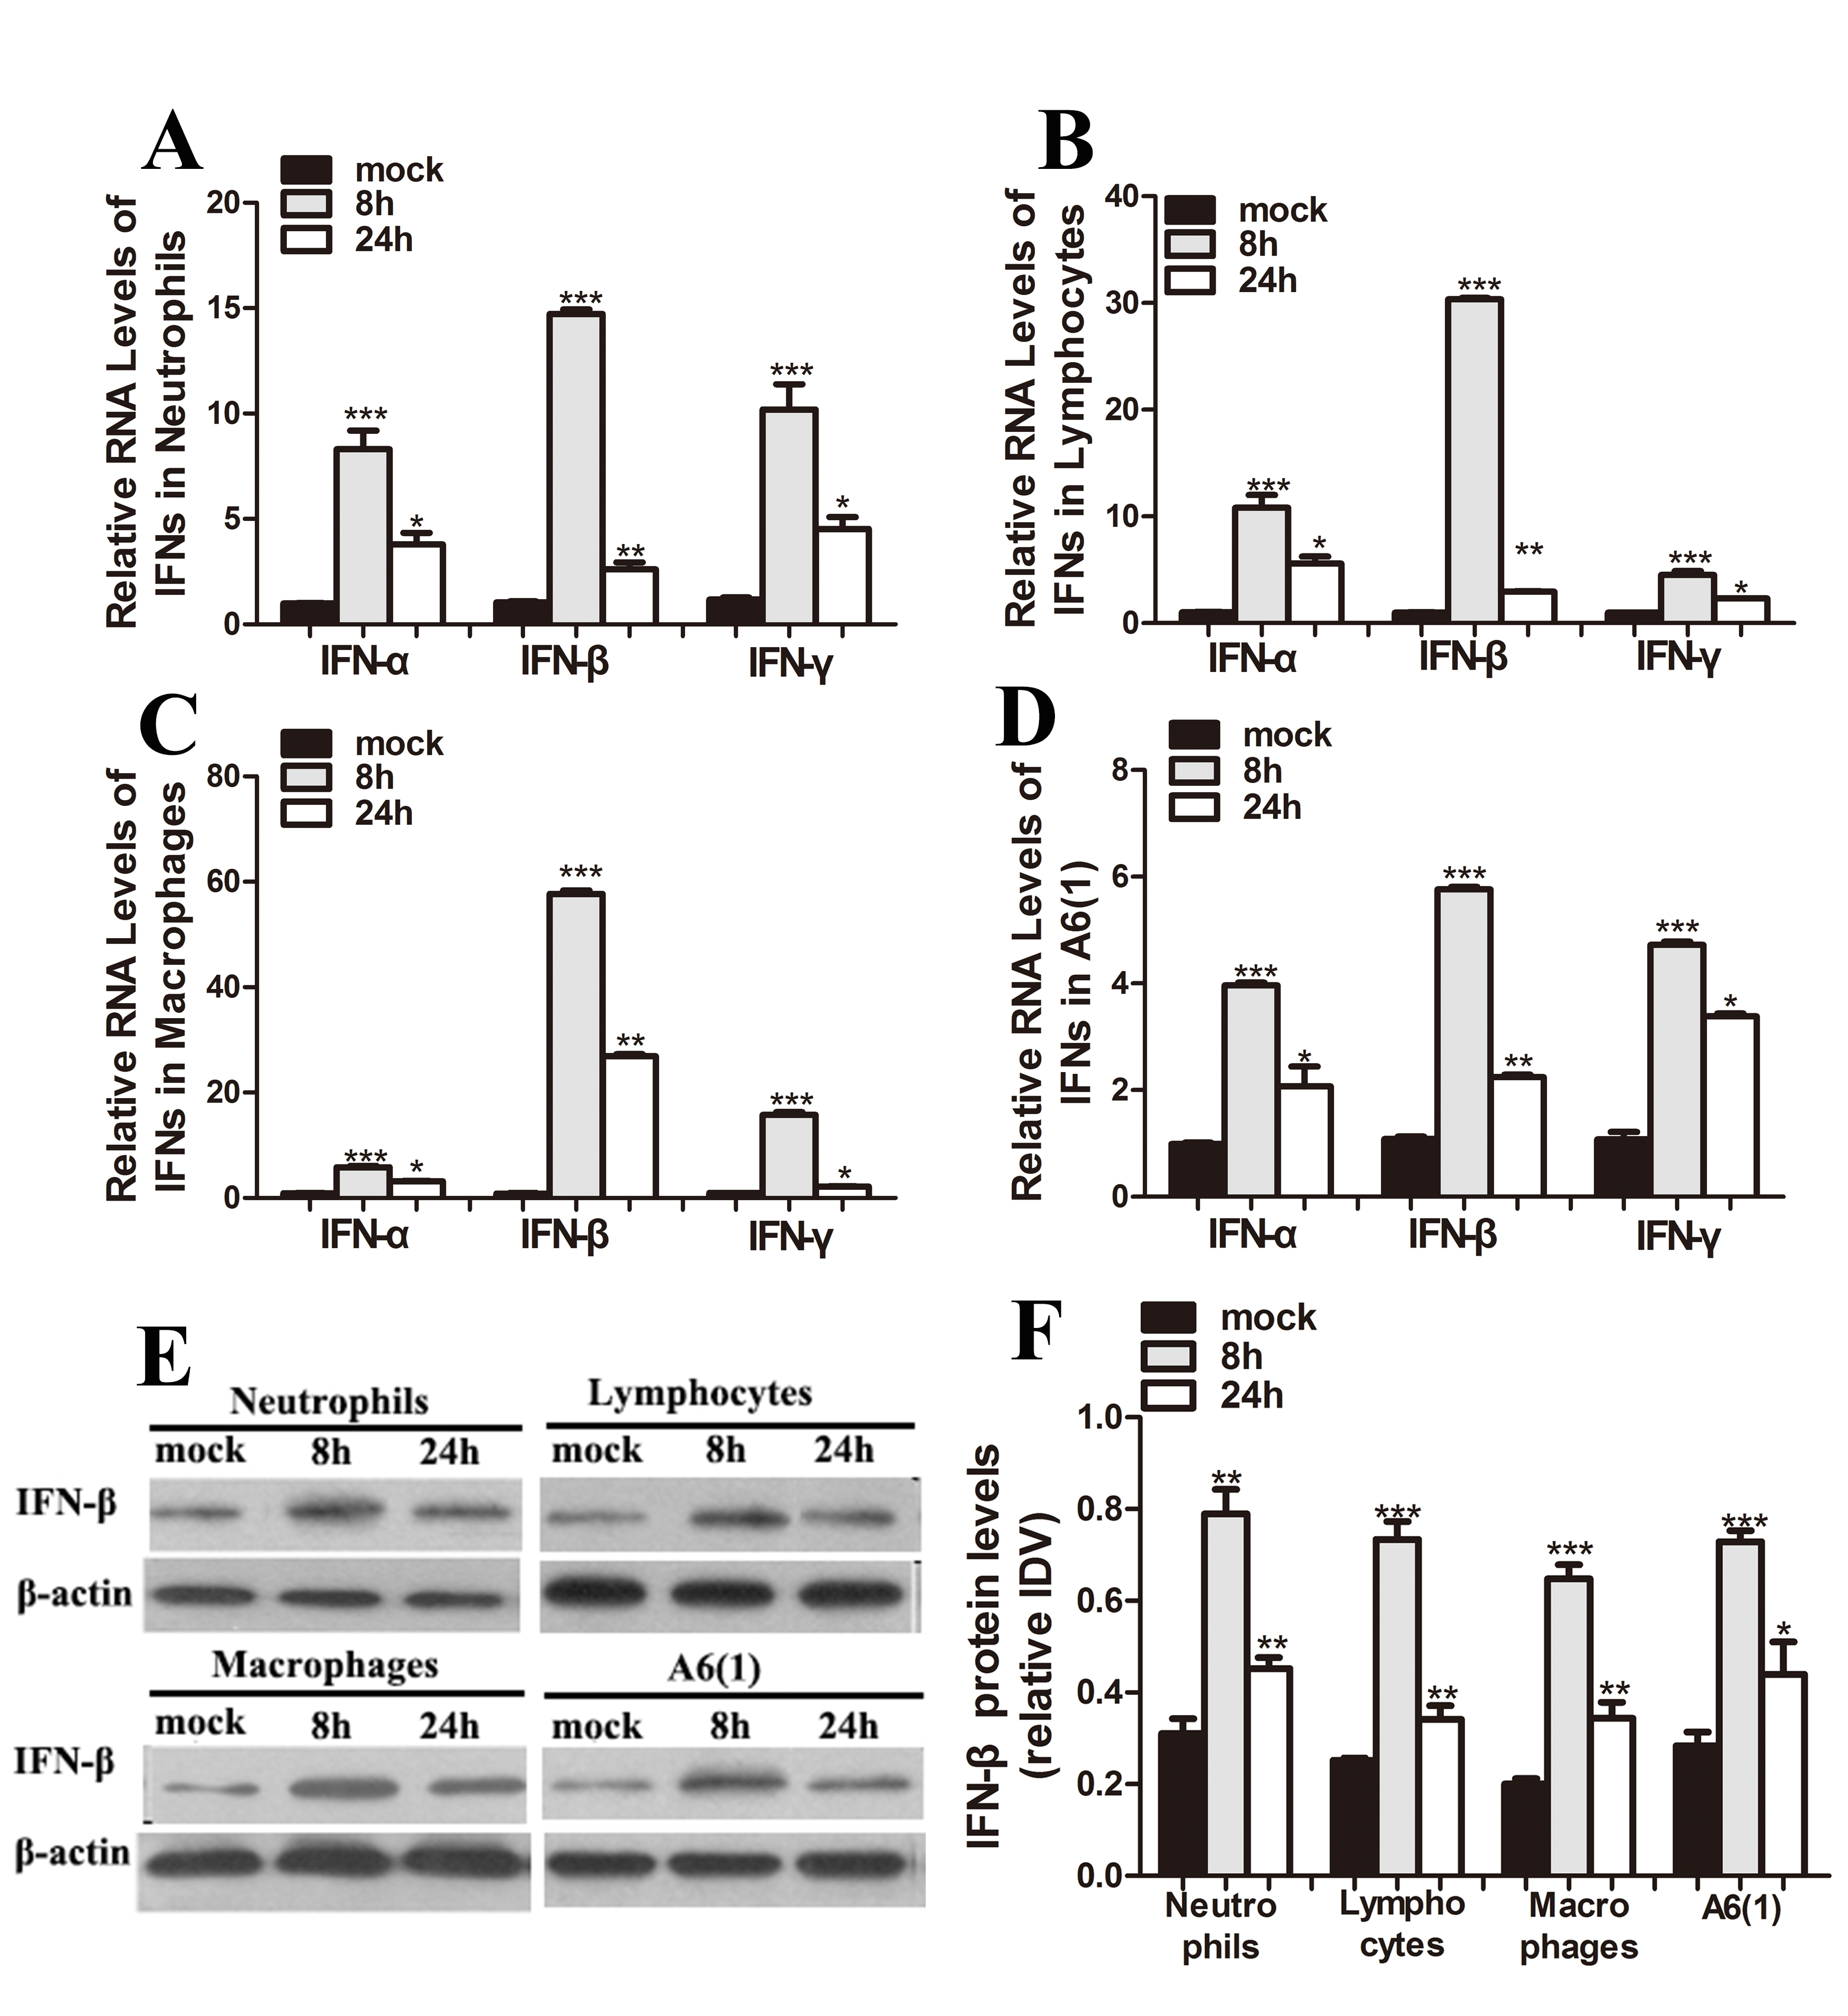
 Figure 1 of
Zhong, Mol Vis 2018; 24:187-200.
Figure 1 of
Zhong, Mol Vis 2018; 24:187-200.