Figure 4. The differential growth of regenerating axons within BXD strains. The longest distance that five axons regenerated (A) and the longest regeneration for a single axon (B) are shown for the two control strains (DBA/2J and C57BL/6J untreated mice) and in nine strains treated with the regeneration
protocol. Boxplots show median, 25th and 75th percentile, maximum, and minimum values for each BXD recombinant inbred strain. Black dots: outliers. *: p<0.05 when compared
with BXD102. **: p<0.01 when compared with BXD102.
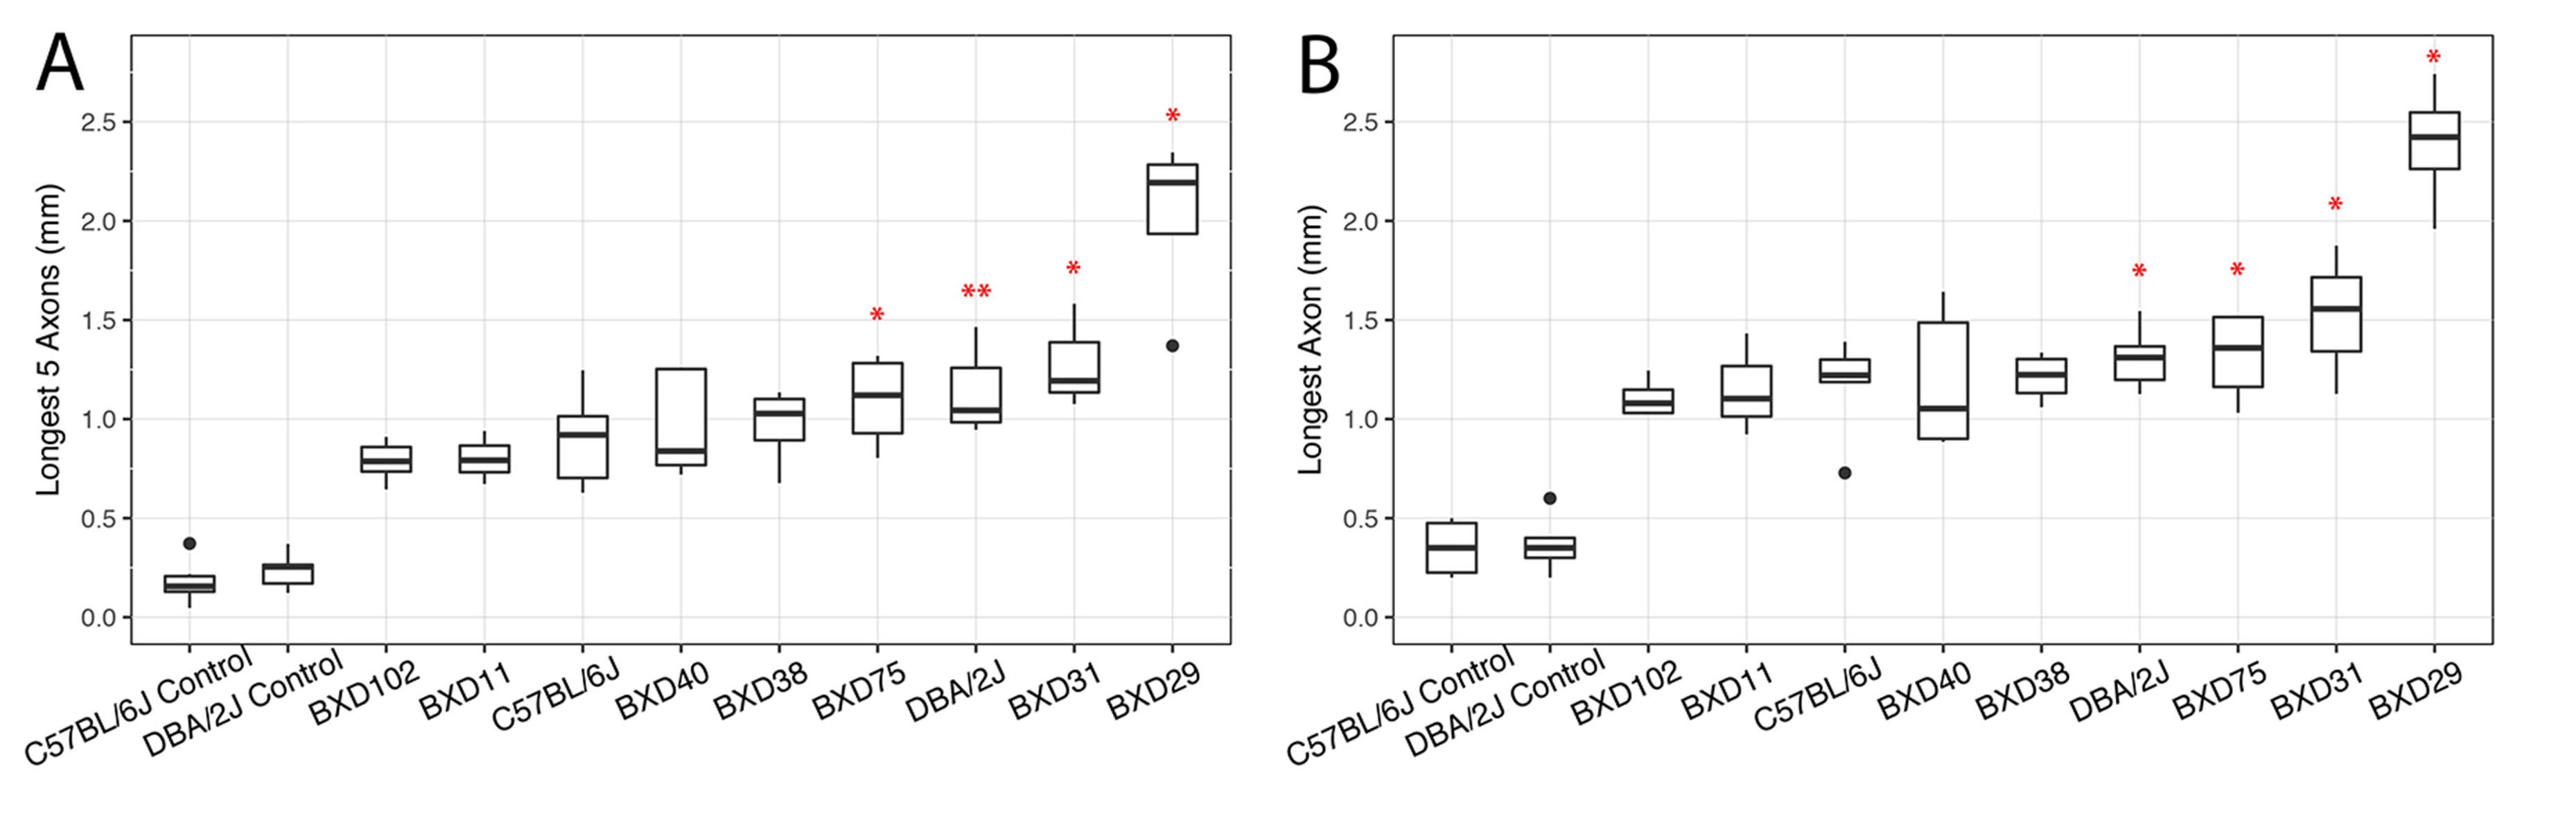
 Figure 4 of
Wang, Mol Vis 2018; 24:174-186.
Figure 4 of
Wang, Mol Vis 2018; 24:174-186.