Figure 3. The differences in the number of regenerating axons in BXD strains. The number of axons at 0.5 mm (A) and 1 mm (B) from the crush site in two control strains (DBA/2J and C57BL/6J untreated mice) and in nine strains treated with the regeneration
protocol. Boxplots show median, 25th and 75th percentile, maximum, and minimum values for each BXD recombinant inbredstrain. Black dots: outliers. *: p<0.05 when compared
with BXD102. **: p<0.01 when compared with BXD102.
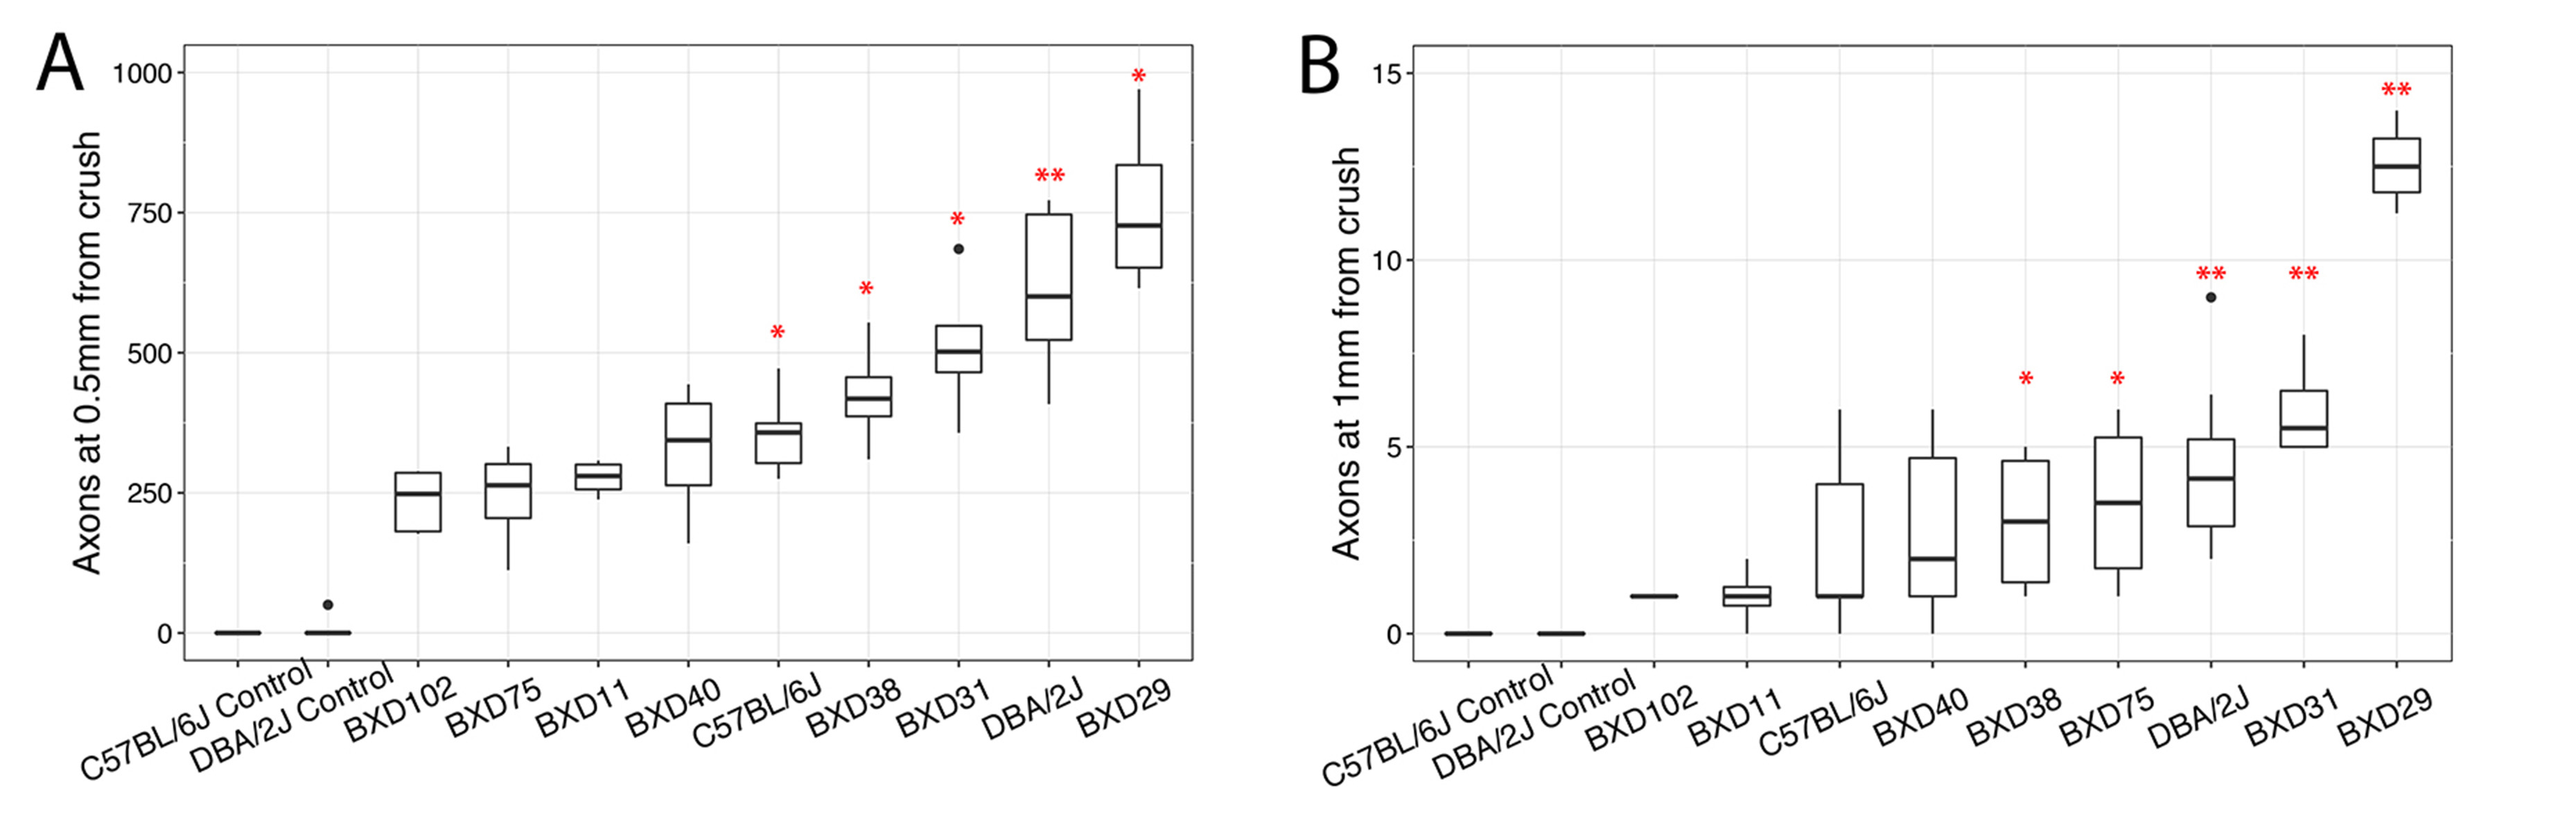
 Figure 3 of
Wang, Mol Vis 2018; 24:174-186.
Figure 3 of
Wang, Mol Vis 2018; 24:174-186.