Figure 4. M-cone ERG responses and M- and L-opsin expression in AAV5-PR2.1-OPN1MW-HA or/and AAV5-PR2.1-OPN1LW-Myc-treated Opn1mw−/− eyes. A: M-cone electroretinogram (ERG) b-wave amplitudes showed similar levels of rescue in OPN1LW-, OPN1MW-, OPN1LW-Myc-, OPN1MW-HA-,
and OPN1LW-Myc + OPN1MW-HA mixture-treated eyes. Each bar represents the mean ± standard error of the mean (SEM) of M-cone
b-wave amplitudes recorded at 1.4 log cd.s/m2. There is no difference among any of the treatments (n = 5, **p>0.05), and they are all statistically significantly higher
than those of the untreated controls (*p<0.005). B: M-opsin and HA expression was detected and colocalized in the cone outer segments in the PR2.1-OPN1MW-HA-treated eyes (top
row); and L-opsin and Myc expression was detected and colocalized in the cone outer segments in the PR2.1-OPN1LW-Myc-treated
eyes (bottom row). C: Representative image showing HA and Myc expression in PR2.1-OPN1LW-Myc + PR2.1-OPN1MW-HA mixture-treated eyes. Scale bar:
20 µm.
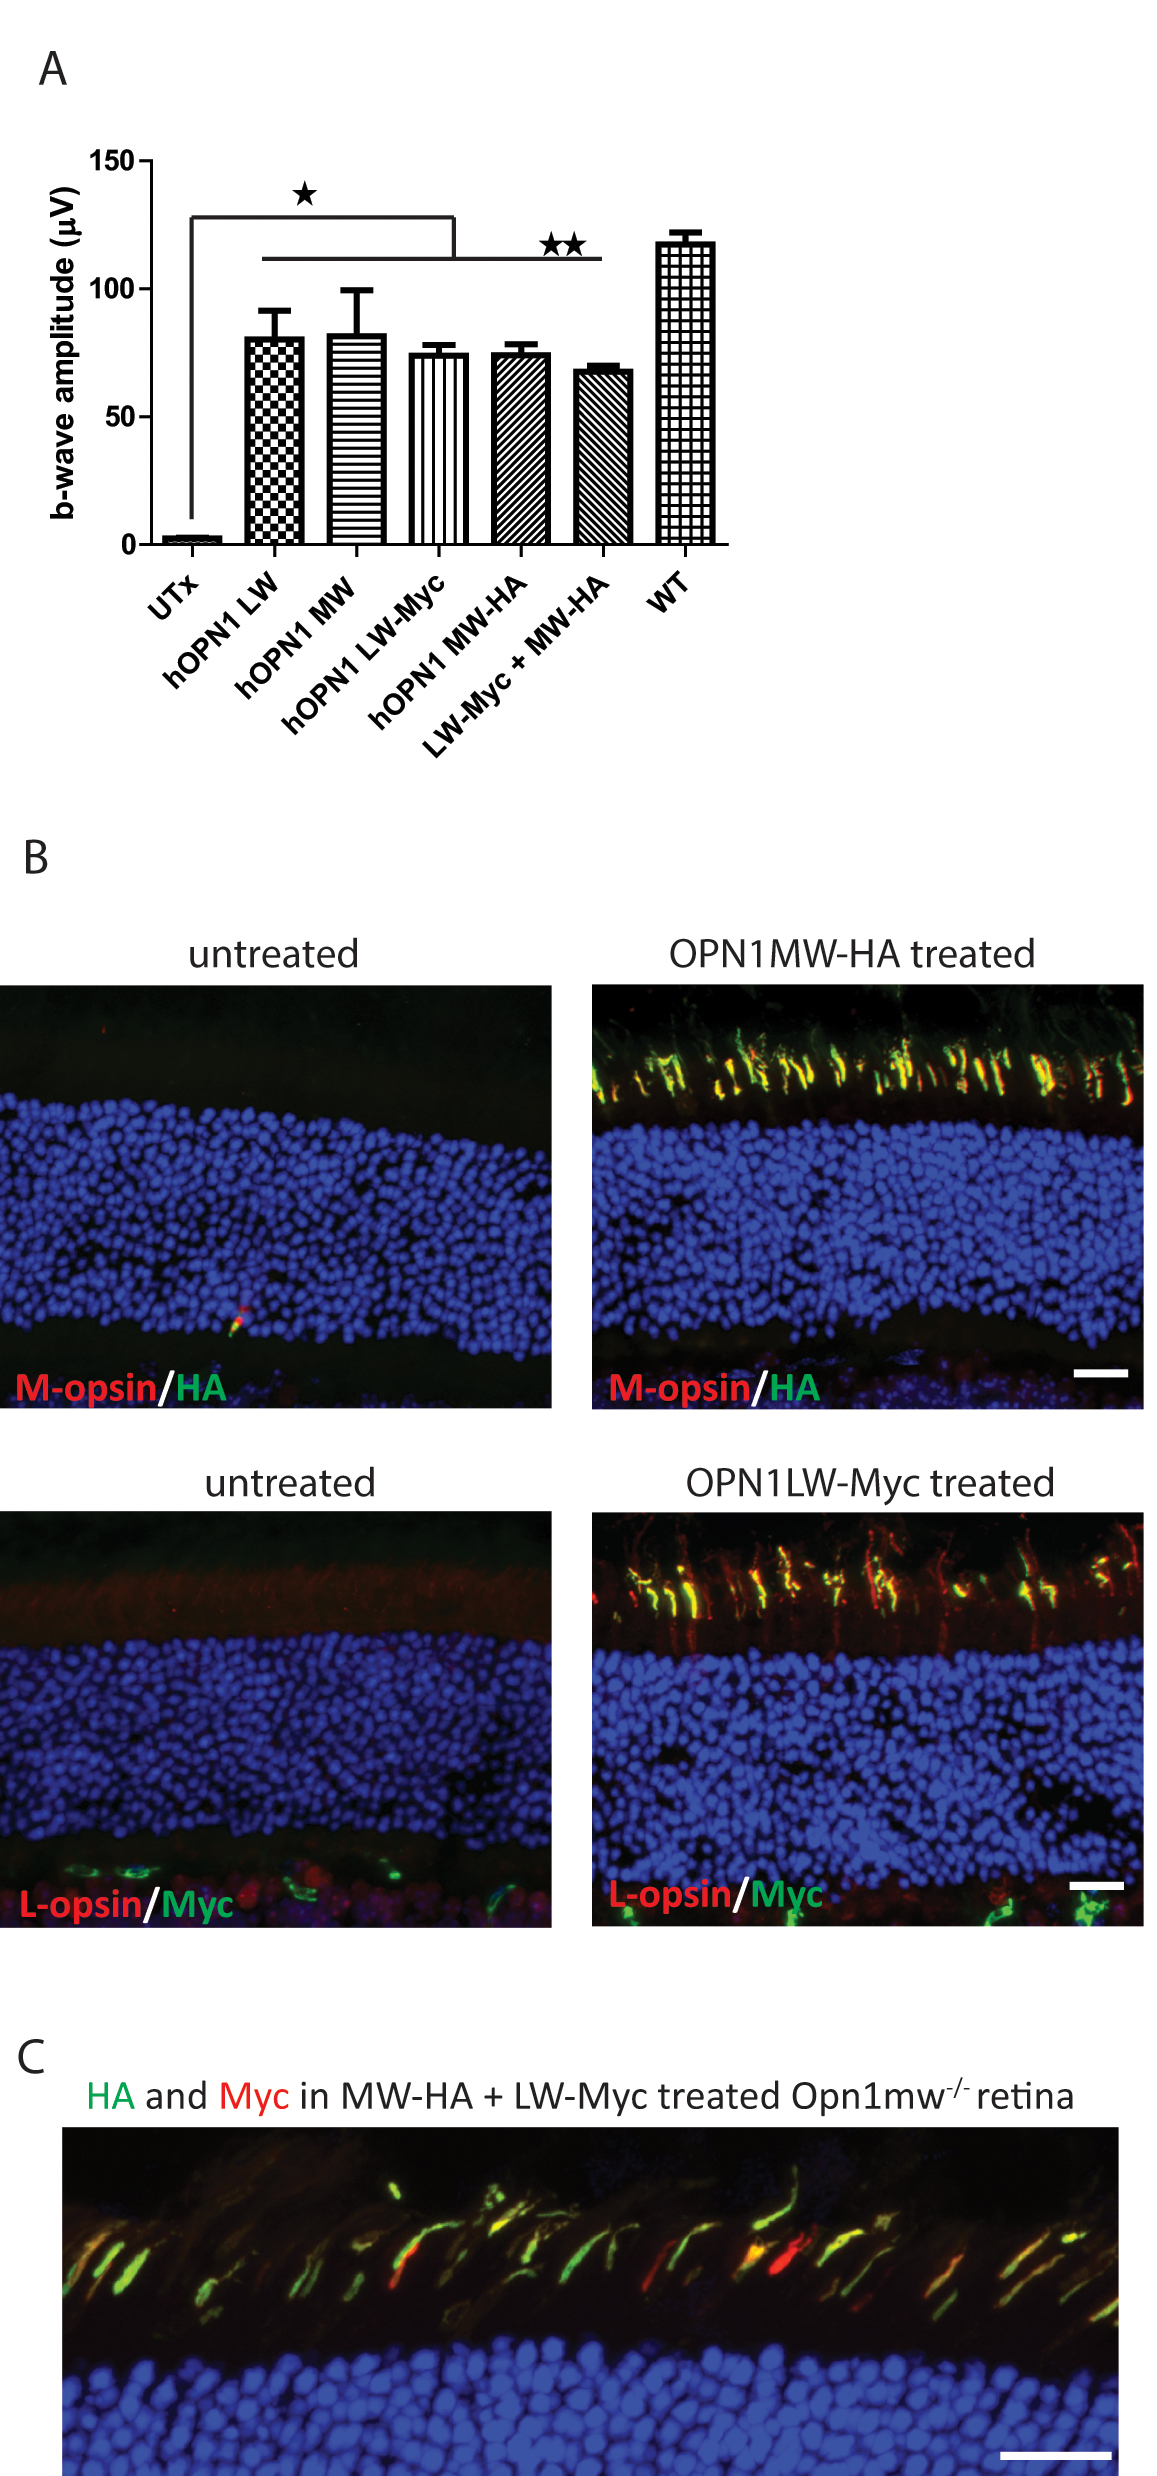
 Figure 4 of
Deng, Mol Vis 2018; 24:17-28.
Figure 4 of
Deng, Mol Vis 2018; 24:17-28.