Figure 2. ROCs of OPN, variables (clinical and biochemical factors), and the combination of OPN plus variables to predict the presence
of DR. Performance in predicting diabetic retinopathy (DR) was assessed by comparing the area under the curve (AUC) calculated
before and after the addition of OPN levels to the model based on non-parametric approaches. We observed a statistically significant
improvement in the AUC after OPN was added to the model (0.805 (95% confidence interval [CI], 0.763–0.846) versus 0.825, (95%
CI, 0.785–0.865), p=0.011).
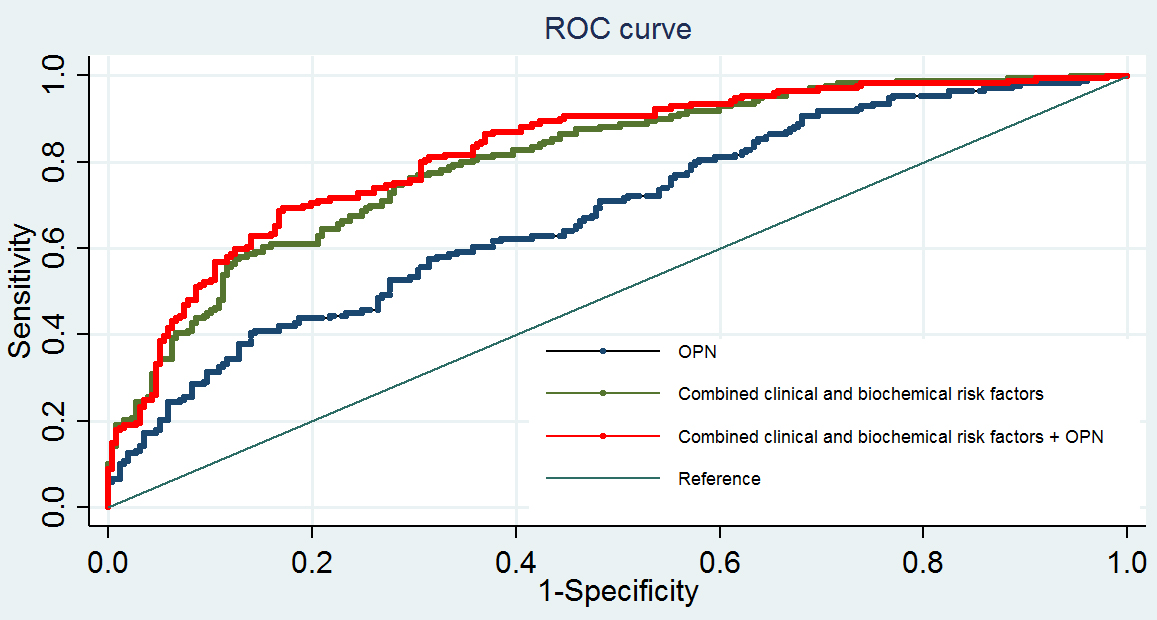
 Figure 2 of
Zhang, Mol Vis 2018; 24:165-173.
Figure 2 of
Zhang, Mol Vis 2018; 24:165-173.