Figure 2. Heatmap and hierarchical clustering dendrogram of all DEGs across the Q344X and WT biologic replicates. Each column represents
a DEG (FDR p<0.05, absolute FC>=1) where the values represent normalized counts that were standardized to z-scores. The color
indicates the standard deviation increasing (orange) or decreasing (blue) relative to the mean (black). Row and column dendrograms
represent the Euclidean clustering method.
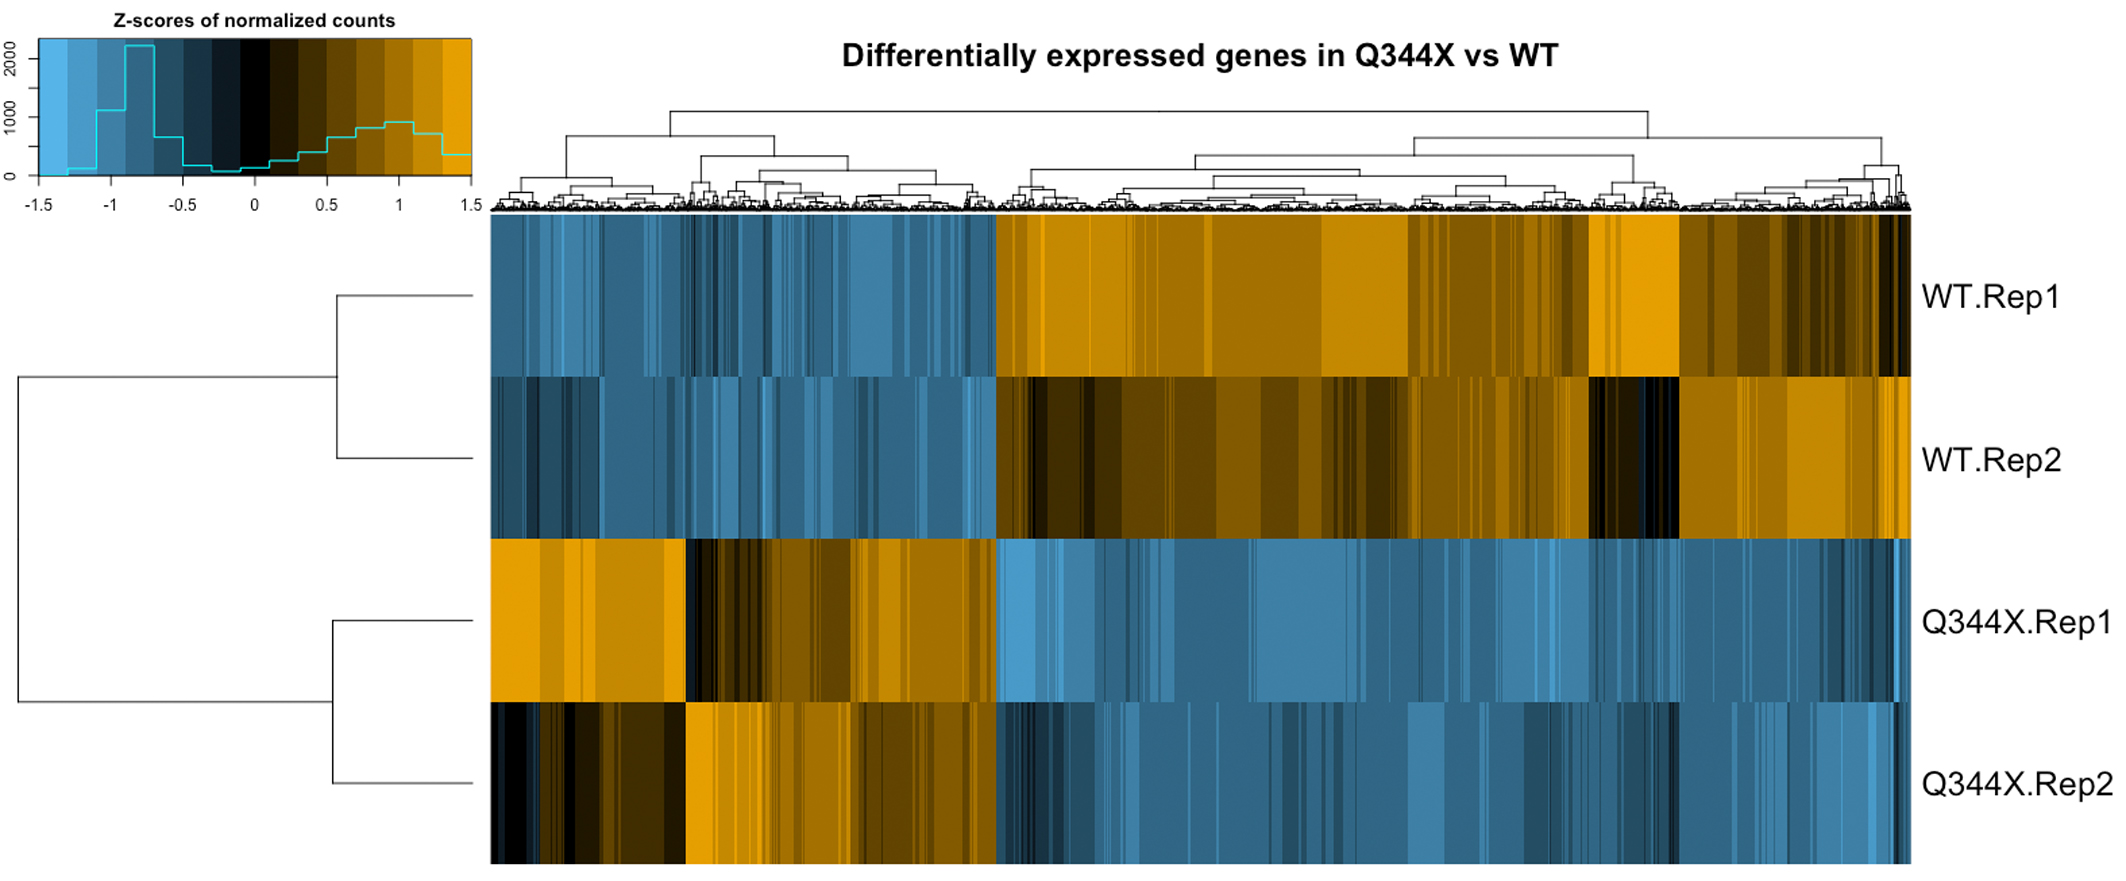
 Figure 2 of
Bales, Mol Vis 2018; 24:153-164.
Figure 2 of
Bales, Mol Vis 2018; 24:153-164.