Figure 1. Transcriptomic alterations in the RP mouse model Q344X. A: Volcano plot of the fold changes and adjusted p values of all genes detected by DESeq2. The horizontal line indicates the
statistical cutoff point (FDR p<0.05), and the vertical lines indicate the cutoff values used from FC. The blue points indicate
genes that were downregulated (1386 genes), and the orange points indicate genes that were upregulated (765 genes). B: Relative changes in transcription for all DEGs. C: Box plots displaying the expression levels as normalized counts for Rho, H1foo, Kcnv2, Hdac9, H3f3b, and Hist2h4.
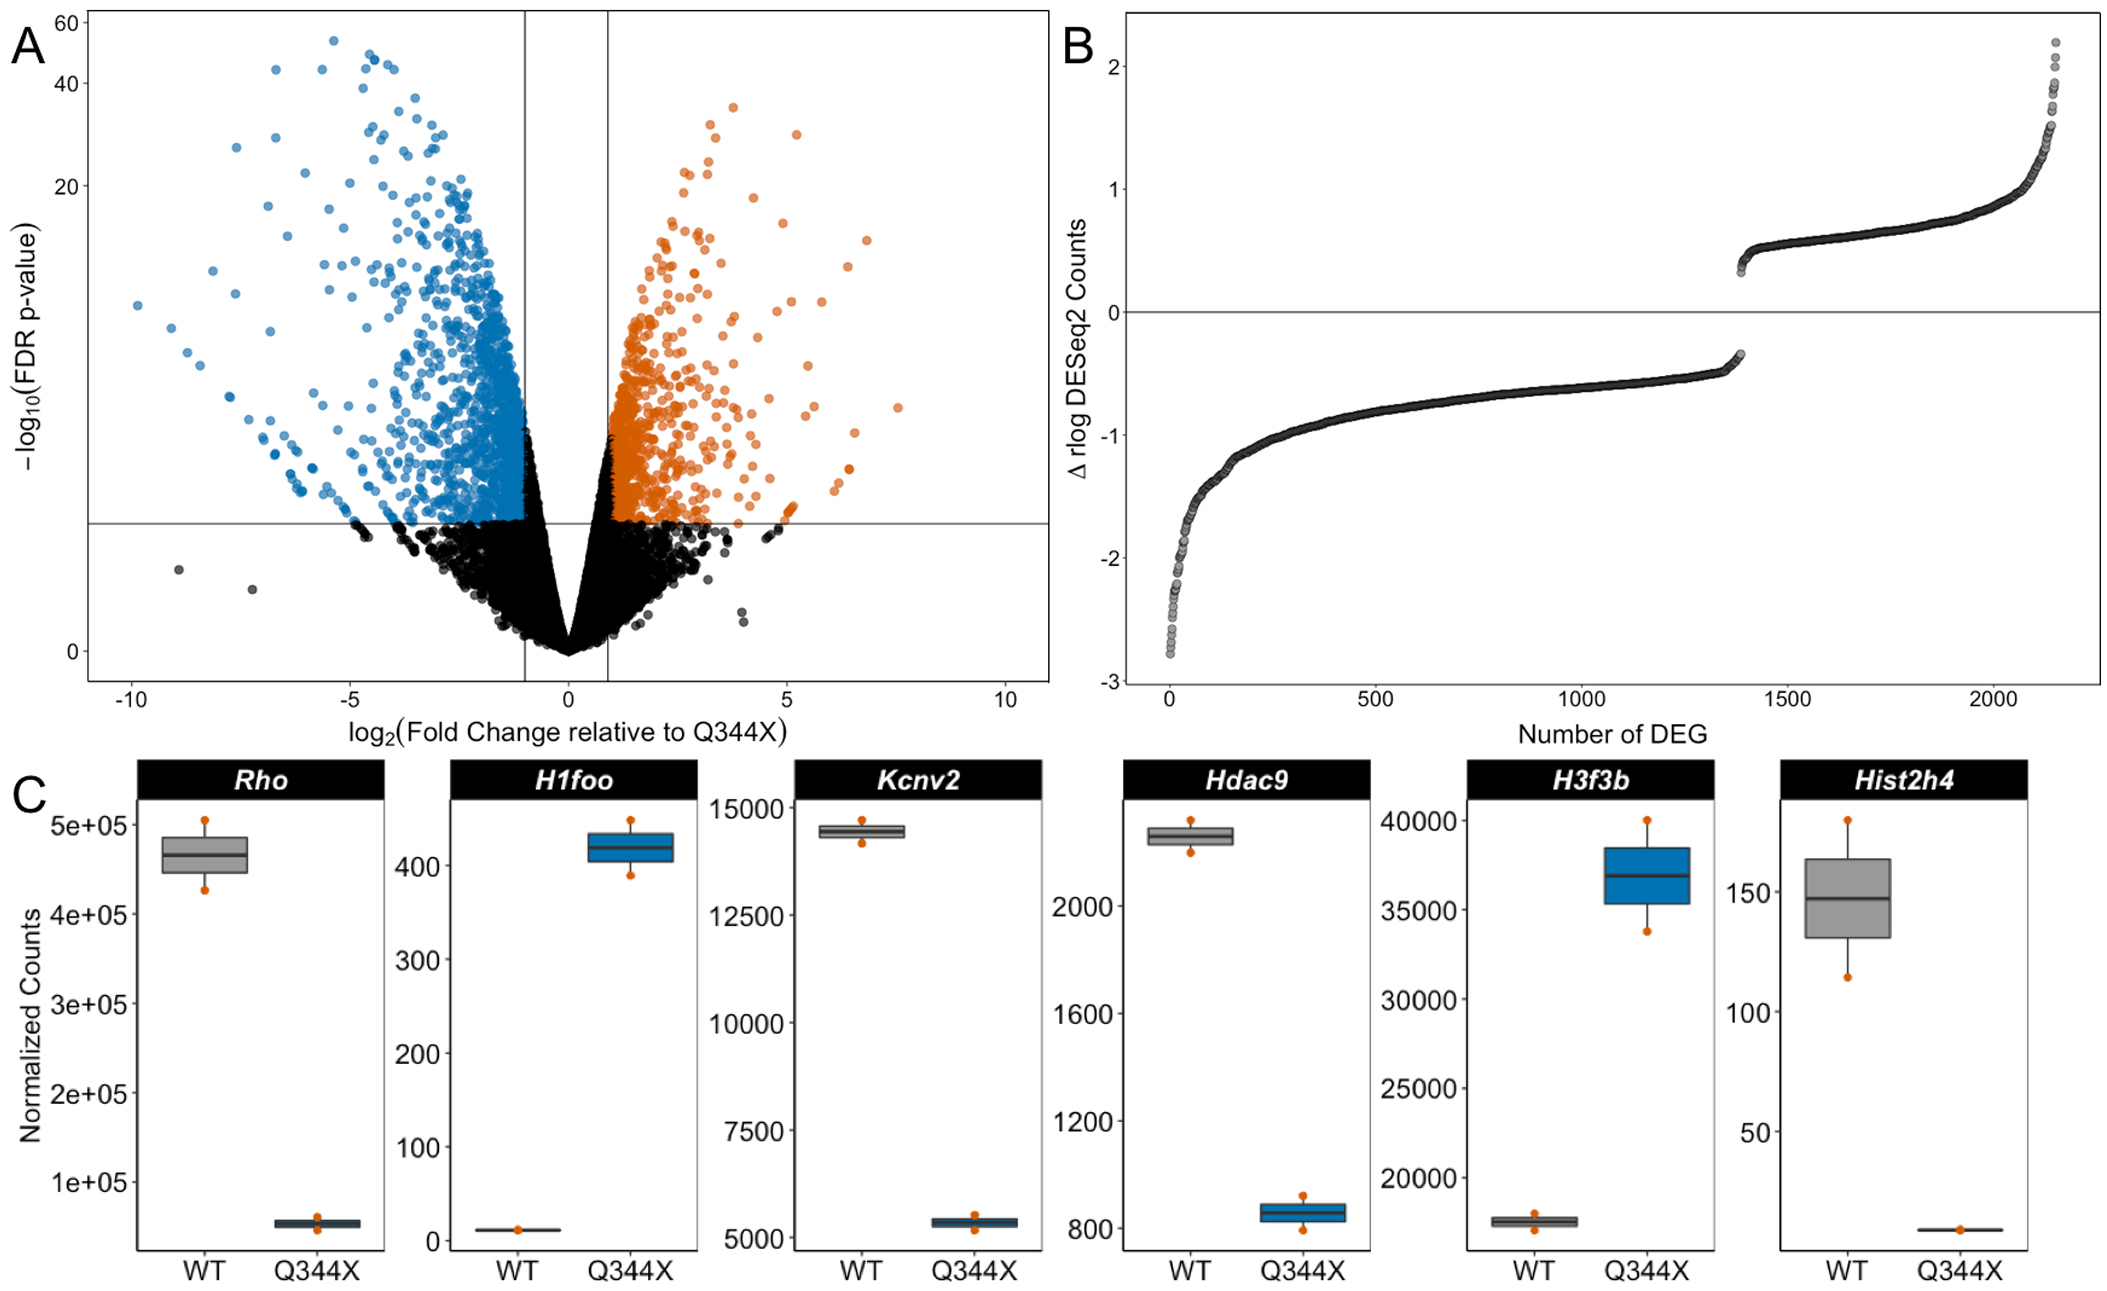
 Figure 1 of
Bales, Mol Vis 2018; 24:153-164.
Figure 1 of
Bales, Mol Vis 2018; 24:153-164.