Figure 6 of
Wang, Mol Vis 2018; 24:143-152.
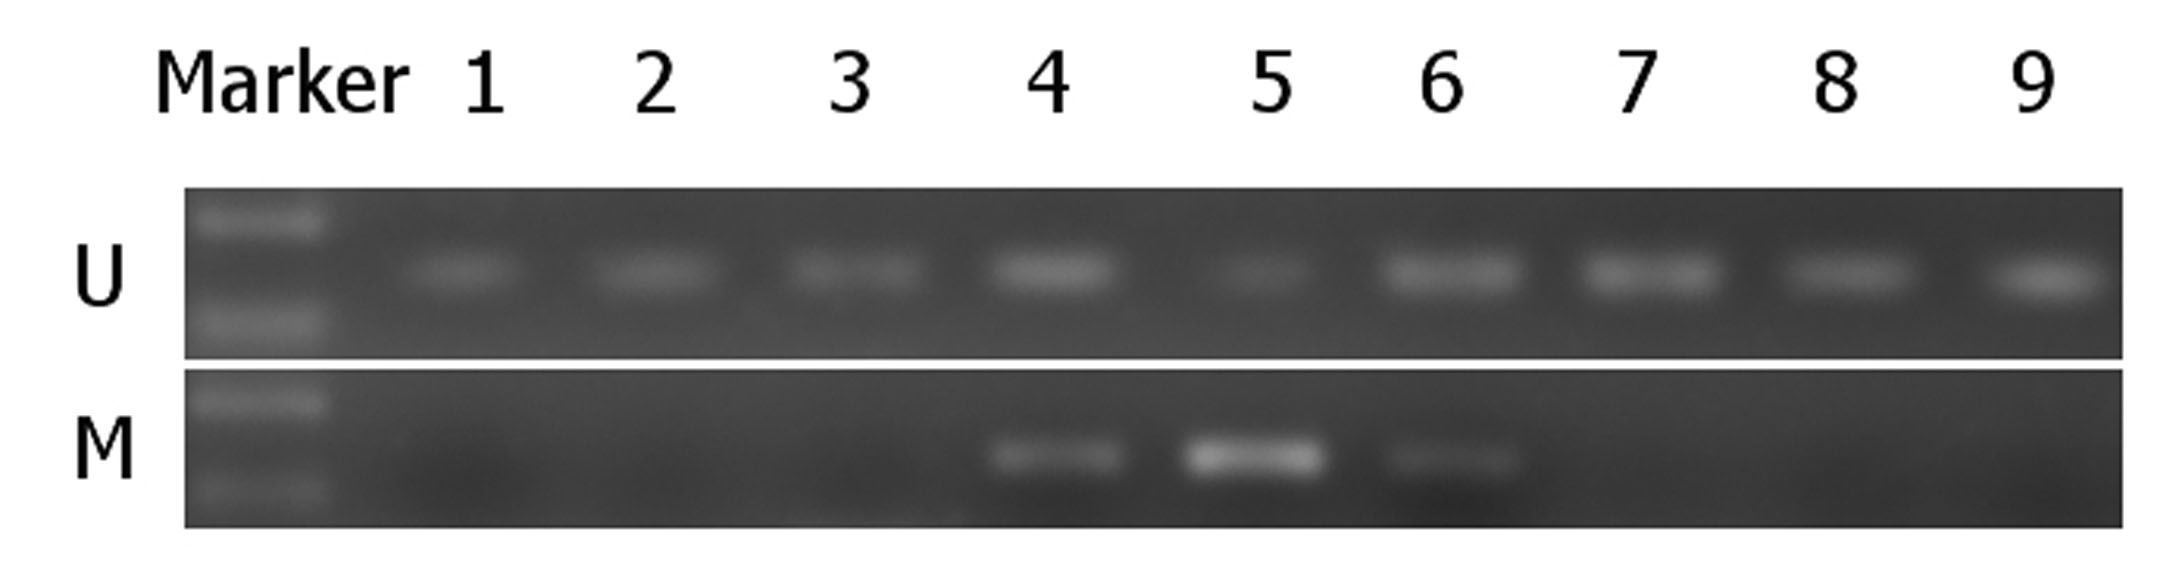
Figure 6.
MSP analysis of p16 in representative examples. DNA was amplified with primers specific to the unmethylated (U) or the methylated (M) CpG islands.
 Figure 6 of
Wang, Mol Vis 2018; 24:143-152.
Figure 6 of
Wang, Mol Vis 2018; 24:143-152.