Figure 2 of
Shah, Mol Vis 2018; 24:127-142.
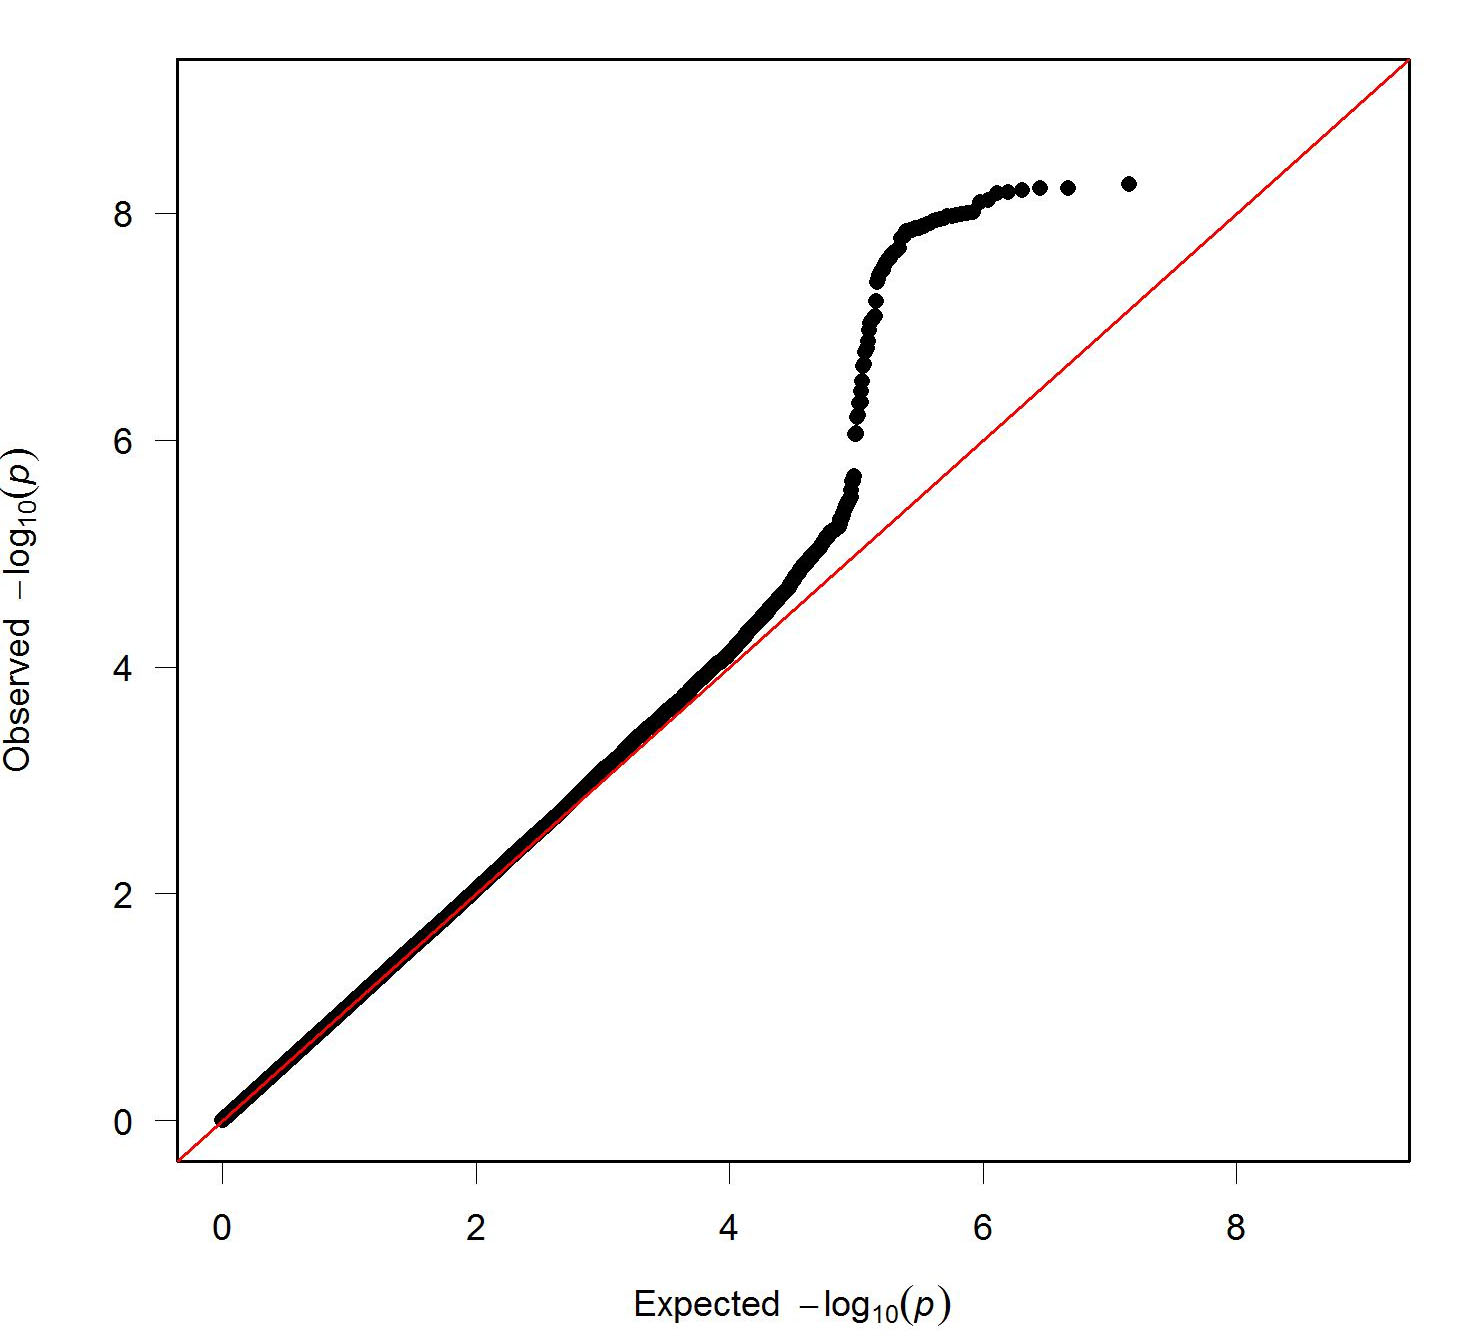
Figure 2.
Q-Q plot for the GWAS fixed-effects meta-analysis for European and Asian participants of all ages combined (n=31,375).
 Figure 2 of
Shah, Mol Vis 2018; 24:127-142. Figure 2 of
Shah, Mol Vis 2018; 24:127-142.
Figure 2 of
Shah, Mol Vis 2018; 24:127-142. Figure 2 of
Shah, Mol Vis 2018; 24:127-142.