Figure 1 of
Shah, Mol Vis 2018; 24:127-142.
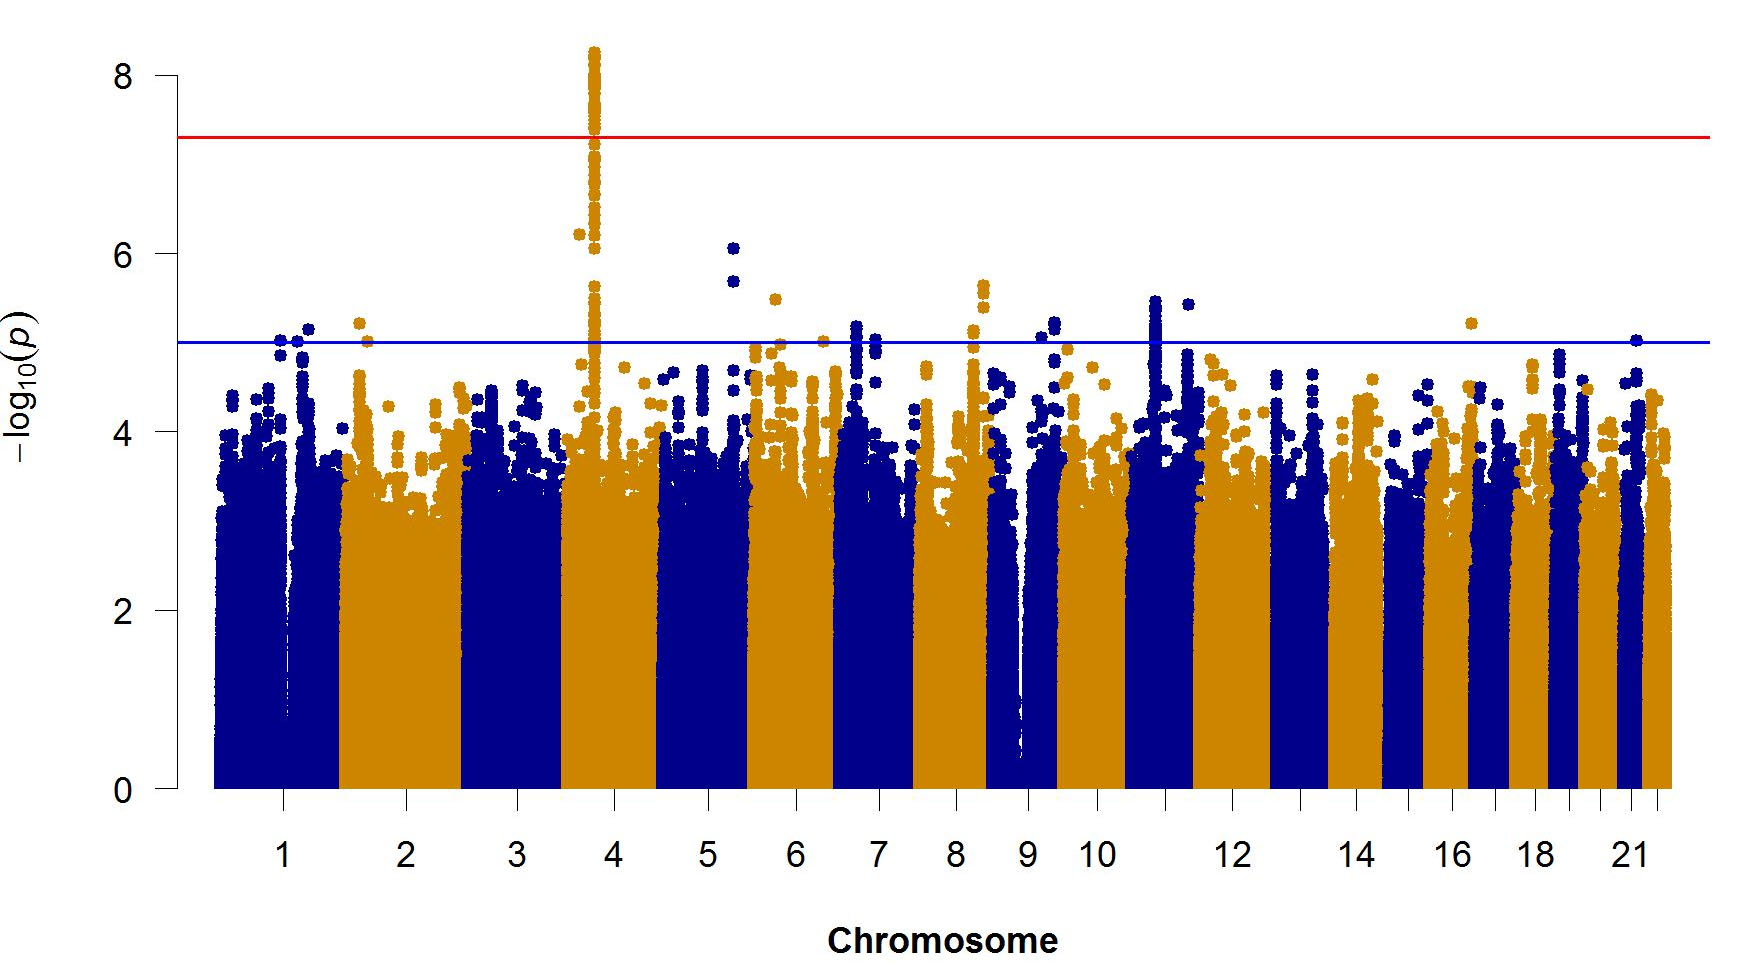
Figure 1.
Manhattan plot showing most strongly associated markers in the GWAS fixed-effects meta-analysis for European and Asian participants of all ages combined (n=31,375). Red line: p=5×10
−8
, blue line: p=1×10
−5
.
 Figure 1 of
Shah, Mol Vis 2018; 24:127-142.
Figure 1 of
Shah, Mol Vis 2018; 24:127-142.