Figure 5. Myo7a gene network graph created using the Gene-set Cohesion Analysis Tool described in the Methods section. These genes may be
functionally related. Gene symbols are located at nodes in circles, and the lines interconnecting the nodes are based on literature
correlations. The literature p value for these genes is 1.693507e-17. This computation was based on the 40 terms that most
frequently co-occur with Myo7a.
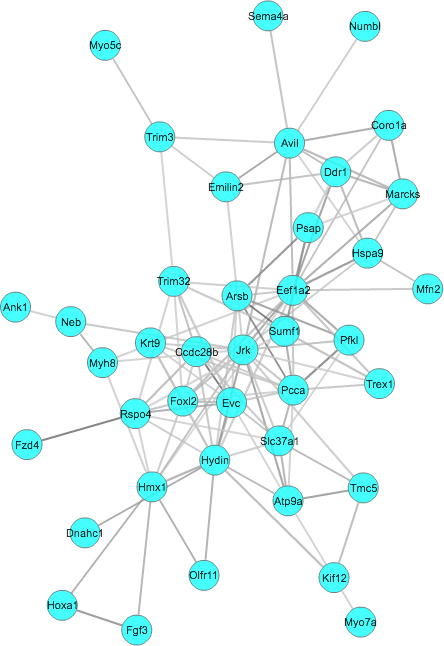
 Figure 5 of
Lu, Mol Vis 2018; 24:115-126.
Figure 5 of
Lu, Mol Vis 2018; 24:115-126.