Figure 4. Genetic mapping of Myo7a. A statistically significant expression quantitative trait locus (eQTL) is present at the location of Myo7a itself (the triangle on the x-axis) on chromosome 7, making it a cis-eQTL. The left y-axis provides the likelihood ratio statistic (LRS) score in blue, and the right y-axis provides the additive
effect. The red and green lines show the effect of the D or B allele on trait values, respectively. The upper x-axis shows
the location by chromosome, and the lower x-axis shows the location in megabases. The two horizontal lines across the plot
make the threshold for genome-wide statistically significant (p<0.05, red or upper line) and suggestive (p<0.63, gray or lower
line) thresholds.
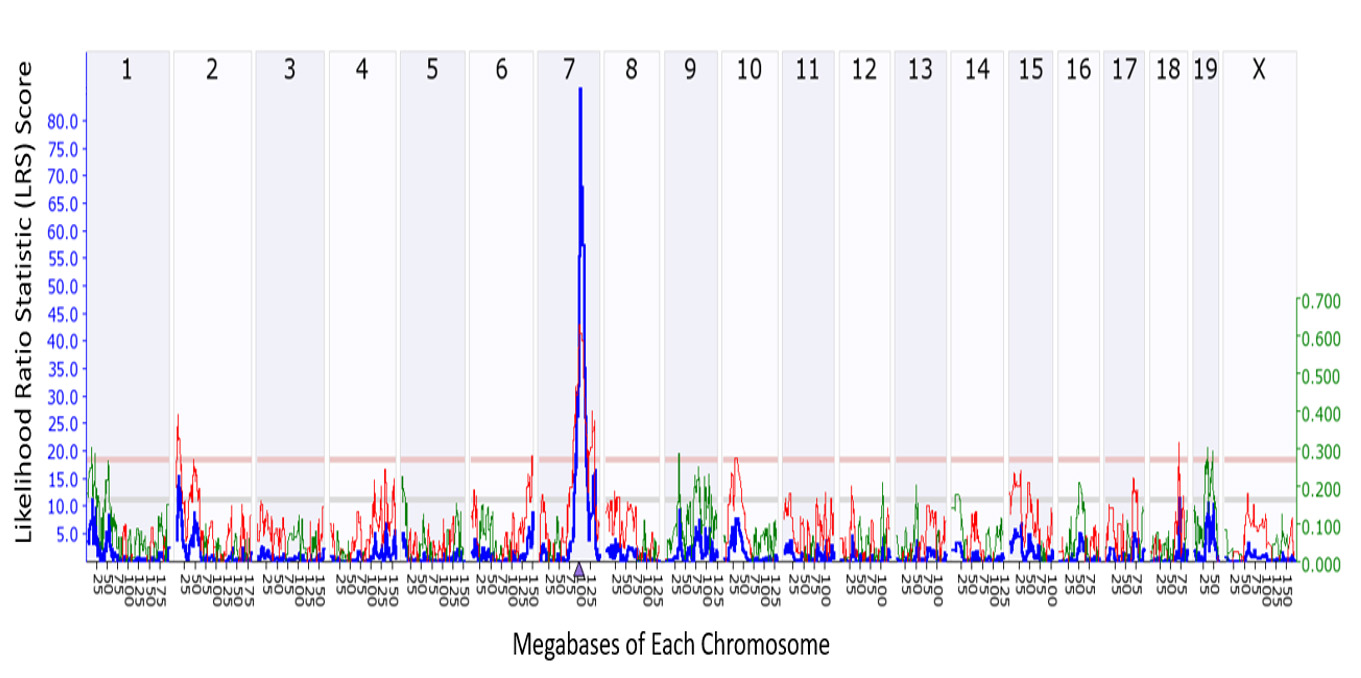
 Figure 4 of
Lu, Mol Vis 2018; 24:115-126.
Figure 4 of
Lu, Mol Vis 2018; 24:115-126.