Figure 3. mRNA expression of Myo7a in the retina for the B6 and D2 strains and eight selected BXD lines. The x-axis denotes the strain while the y-axis denotes
the fold change in the Myo7a gene for the nine strains relative to the B6 strain using the ΔΔcT method. Each bar shows the mean relative expression values
± standard error of the mean (SEM). n=3–5; p<0.0001.
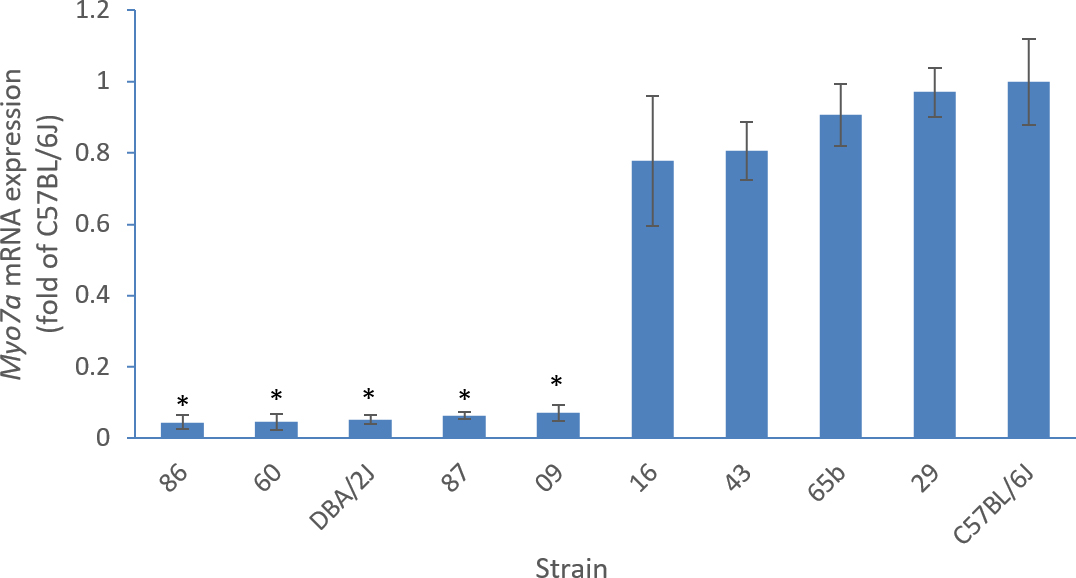
 Figure 3 of
Lu, Mol Vis 2018; 24:115-126.
Figure 3 of
Lu, Mol Vis 2018; 24:115-126.