Figure 3. Representative autofluorescence images from one patient of each group. A and B: Patient 10 in group 1 shows reduced autofluorescence (AF) in the fovea with a surrounding ring of increased AF. Similar
findings were encountered in all patients in group 1 except patient 1 who also demonstrated a pisciform pattern of increased
and reduced AF beyond the central decreased AF. C and D: Patient 24 in group 2 shows a larger central area with the absence of AF surrounded by widespread mottling of increased
and reduced AF. AF images from the other patients in group 2 are similar. E and F: Patient 30 in group 3 is in line with the other patients of the group demonstrating a large central area of absent AF, as
well as widespread rounded flecks of reduced AF around the vascular arcades.
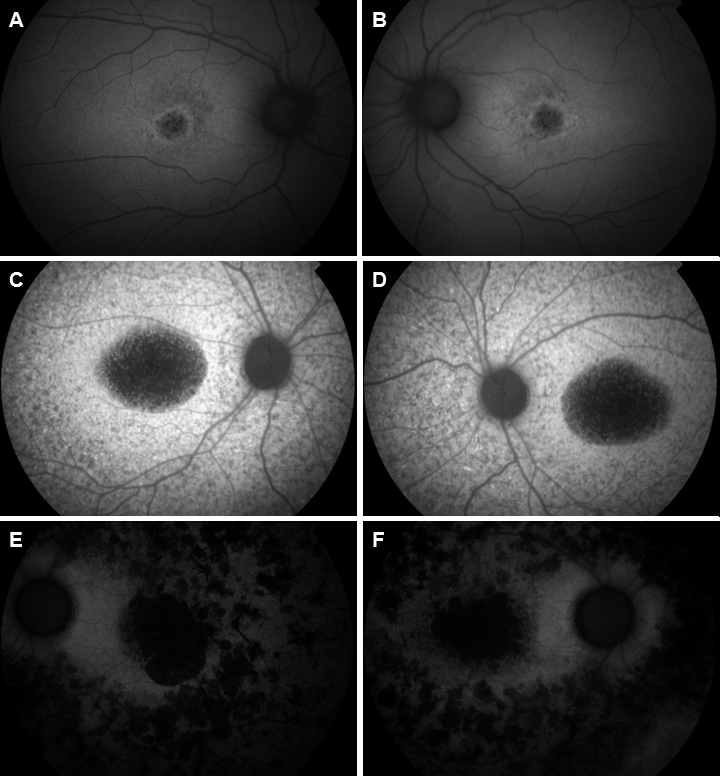
 Figure 3 of
Schroeder, Mol Vis 2018; 24:1-16.
Figure 3 of
Schroeder, Mol Vis 2018; 24:1-16.