Figure 1. Examples of Goldmann visual field plots from one patient in each of the three groups. A: Typical Goldmann visual fields for group 1 with small central scotomas less than 10° (patient 10). B: Group 2 with larger central scotomas from 10° to 35° (patient 24). C: Typical for group 3 with temporal visual field residues (patient 30).
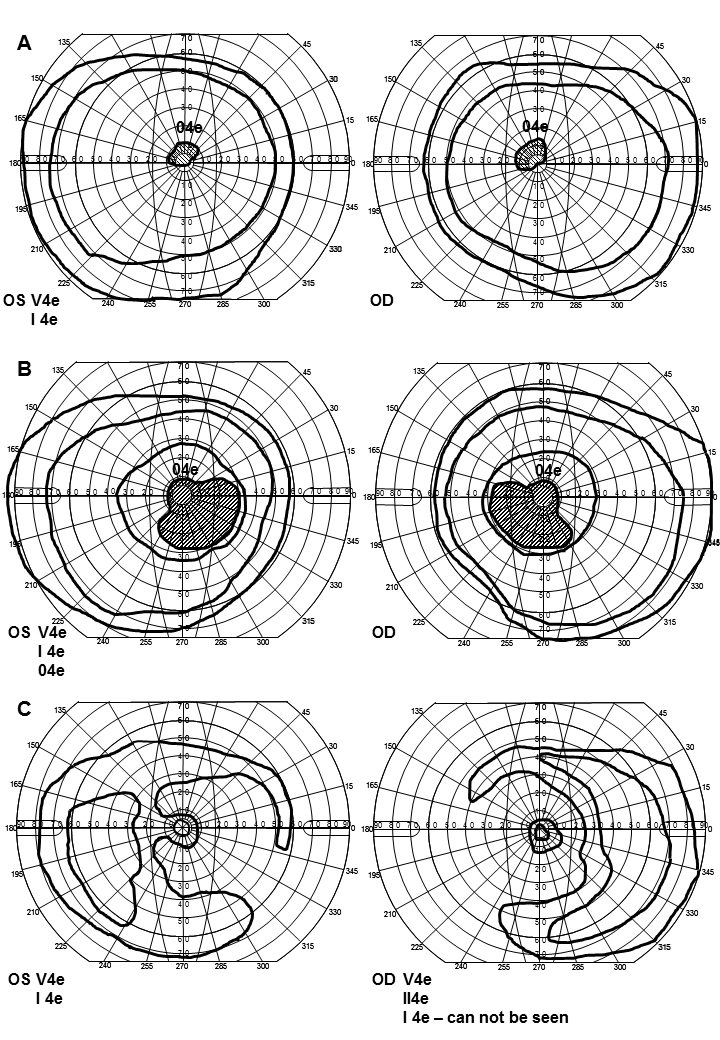
 Figure 1 of
Schroeder, Mol Vis 2018; 24:1-16.
Figure 1 of
Schroeder, Mol Vis 2018; 24:1-16.