Figure 5. Pair-wise comparison of optic nerve injury (vertical) and brain-related CNS neurodegenerative disease (horizontal) data sets
show widespread overlap of (A) enriched DE genes, but not (B) depleted DE genes. The total number of DE genes identified in the independent analysis is shown for each data set. In each
cell, the total number of overlapping genes between two data sets is recorded. Based on Monte Carlo simulations, the cells
are color-coded red for a non-significant overlap, or green for a significant overlap.
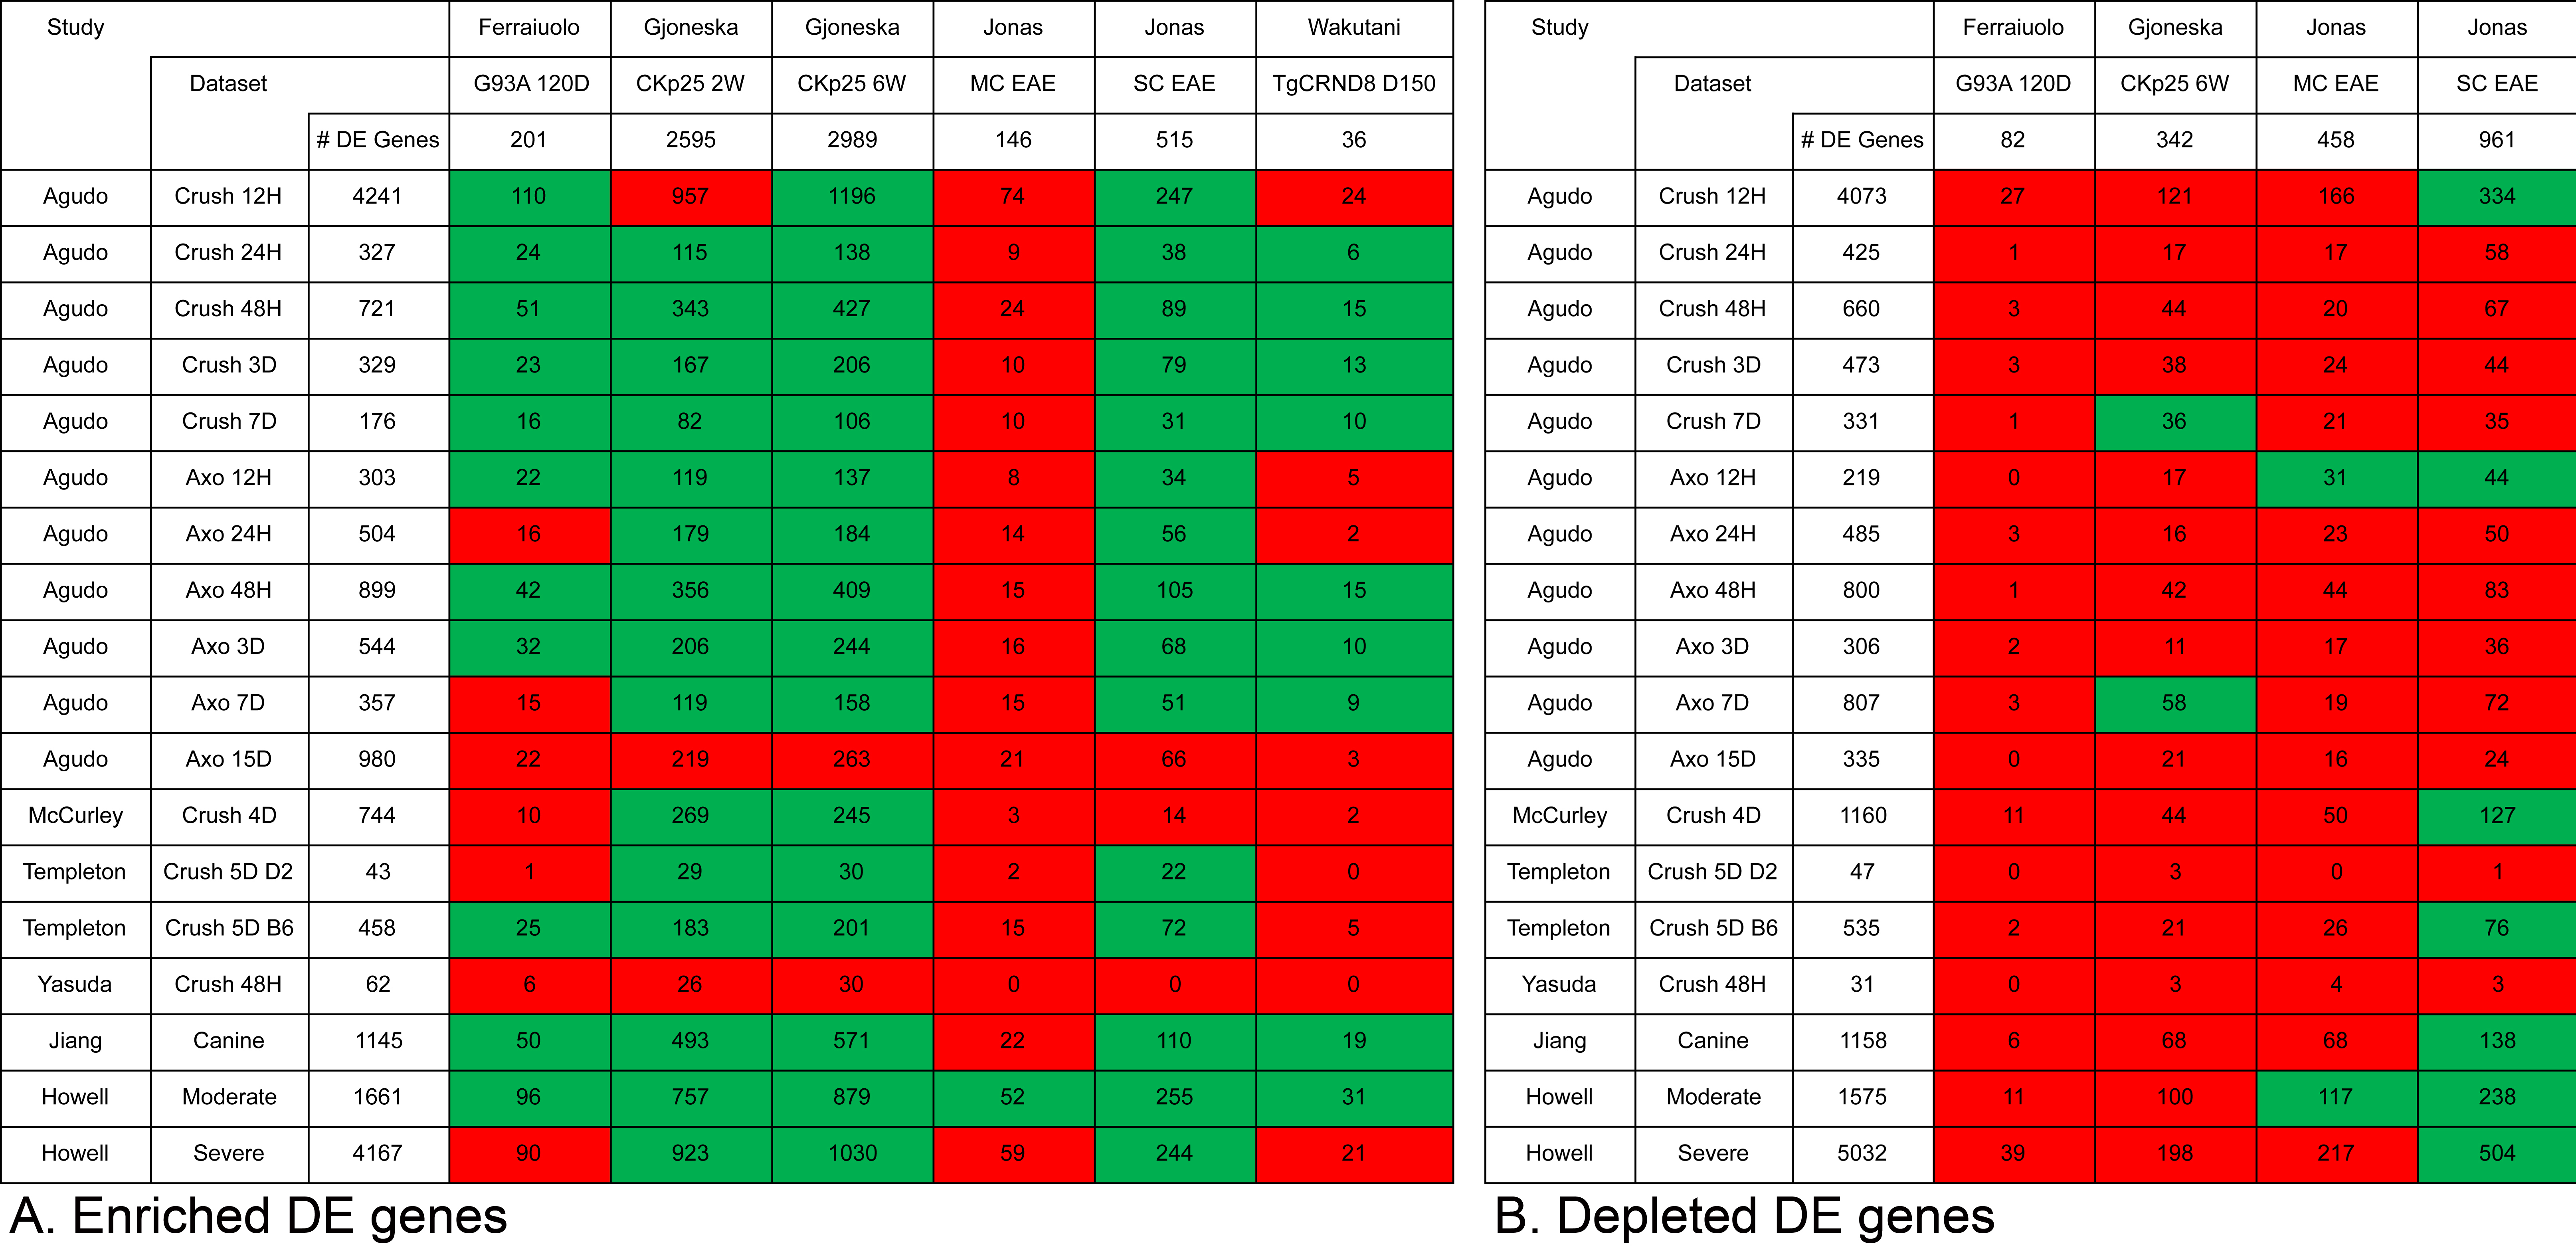
 Figure 5 of
Donahue, Mol Vis 2017; 23:987-1005.
Figure 5 of
Donahue, Mol Vis 2017; 23:987-1005.