Figure 3. Hierarchical clustering of the complete transcriptomes of data sets using the Affymetrix Mouse Genome 430 2.0 Array. The relative
level of every gene in the experimental sample was calculated for all the study data sets that had used this array chip. Hierarchical
clustering was used to determine how similar the transcriptomes were from samples generated by different groups. Overall,
the cluster shows two distinct distant branches, with optic nerve head (ONH) data sets segregating to the upper branch, and
retina data sets segregating to the lower branch. The exceptions to this are the “No or Early” retina data sets from the Howell
study, which have greater similarity to transcriptomes of the ONH, rather than pathologic retinas. Other data sets from studies
of brain-related CNS neurodegeneration appear to distribute between both arms of the cluster.
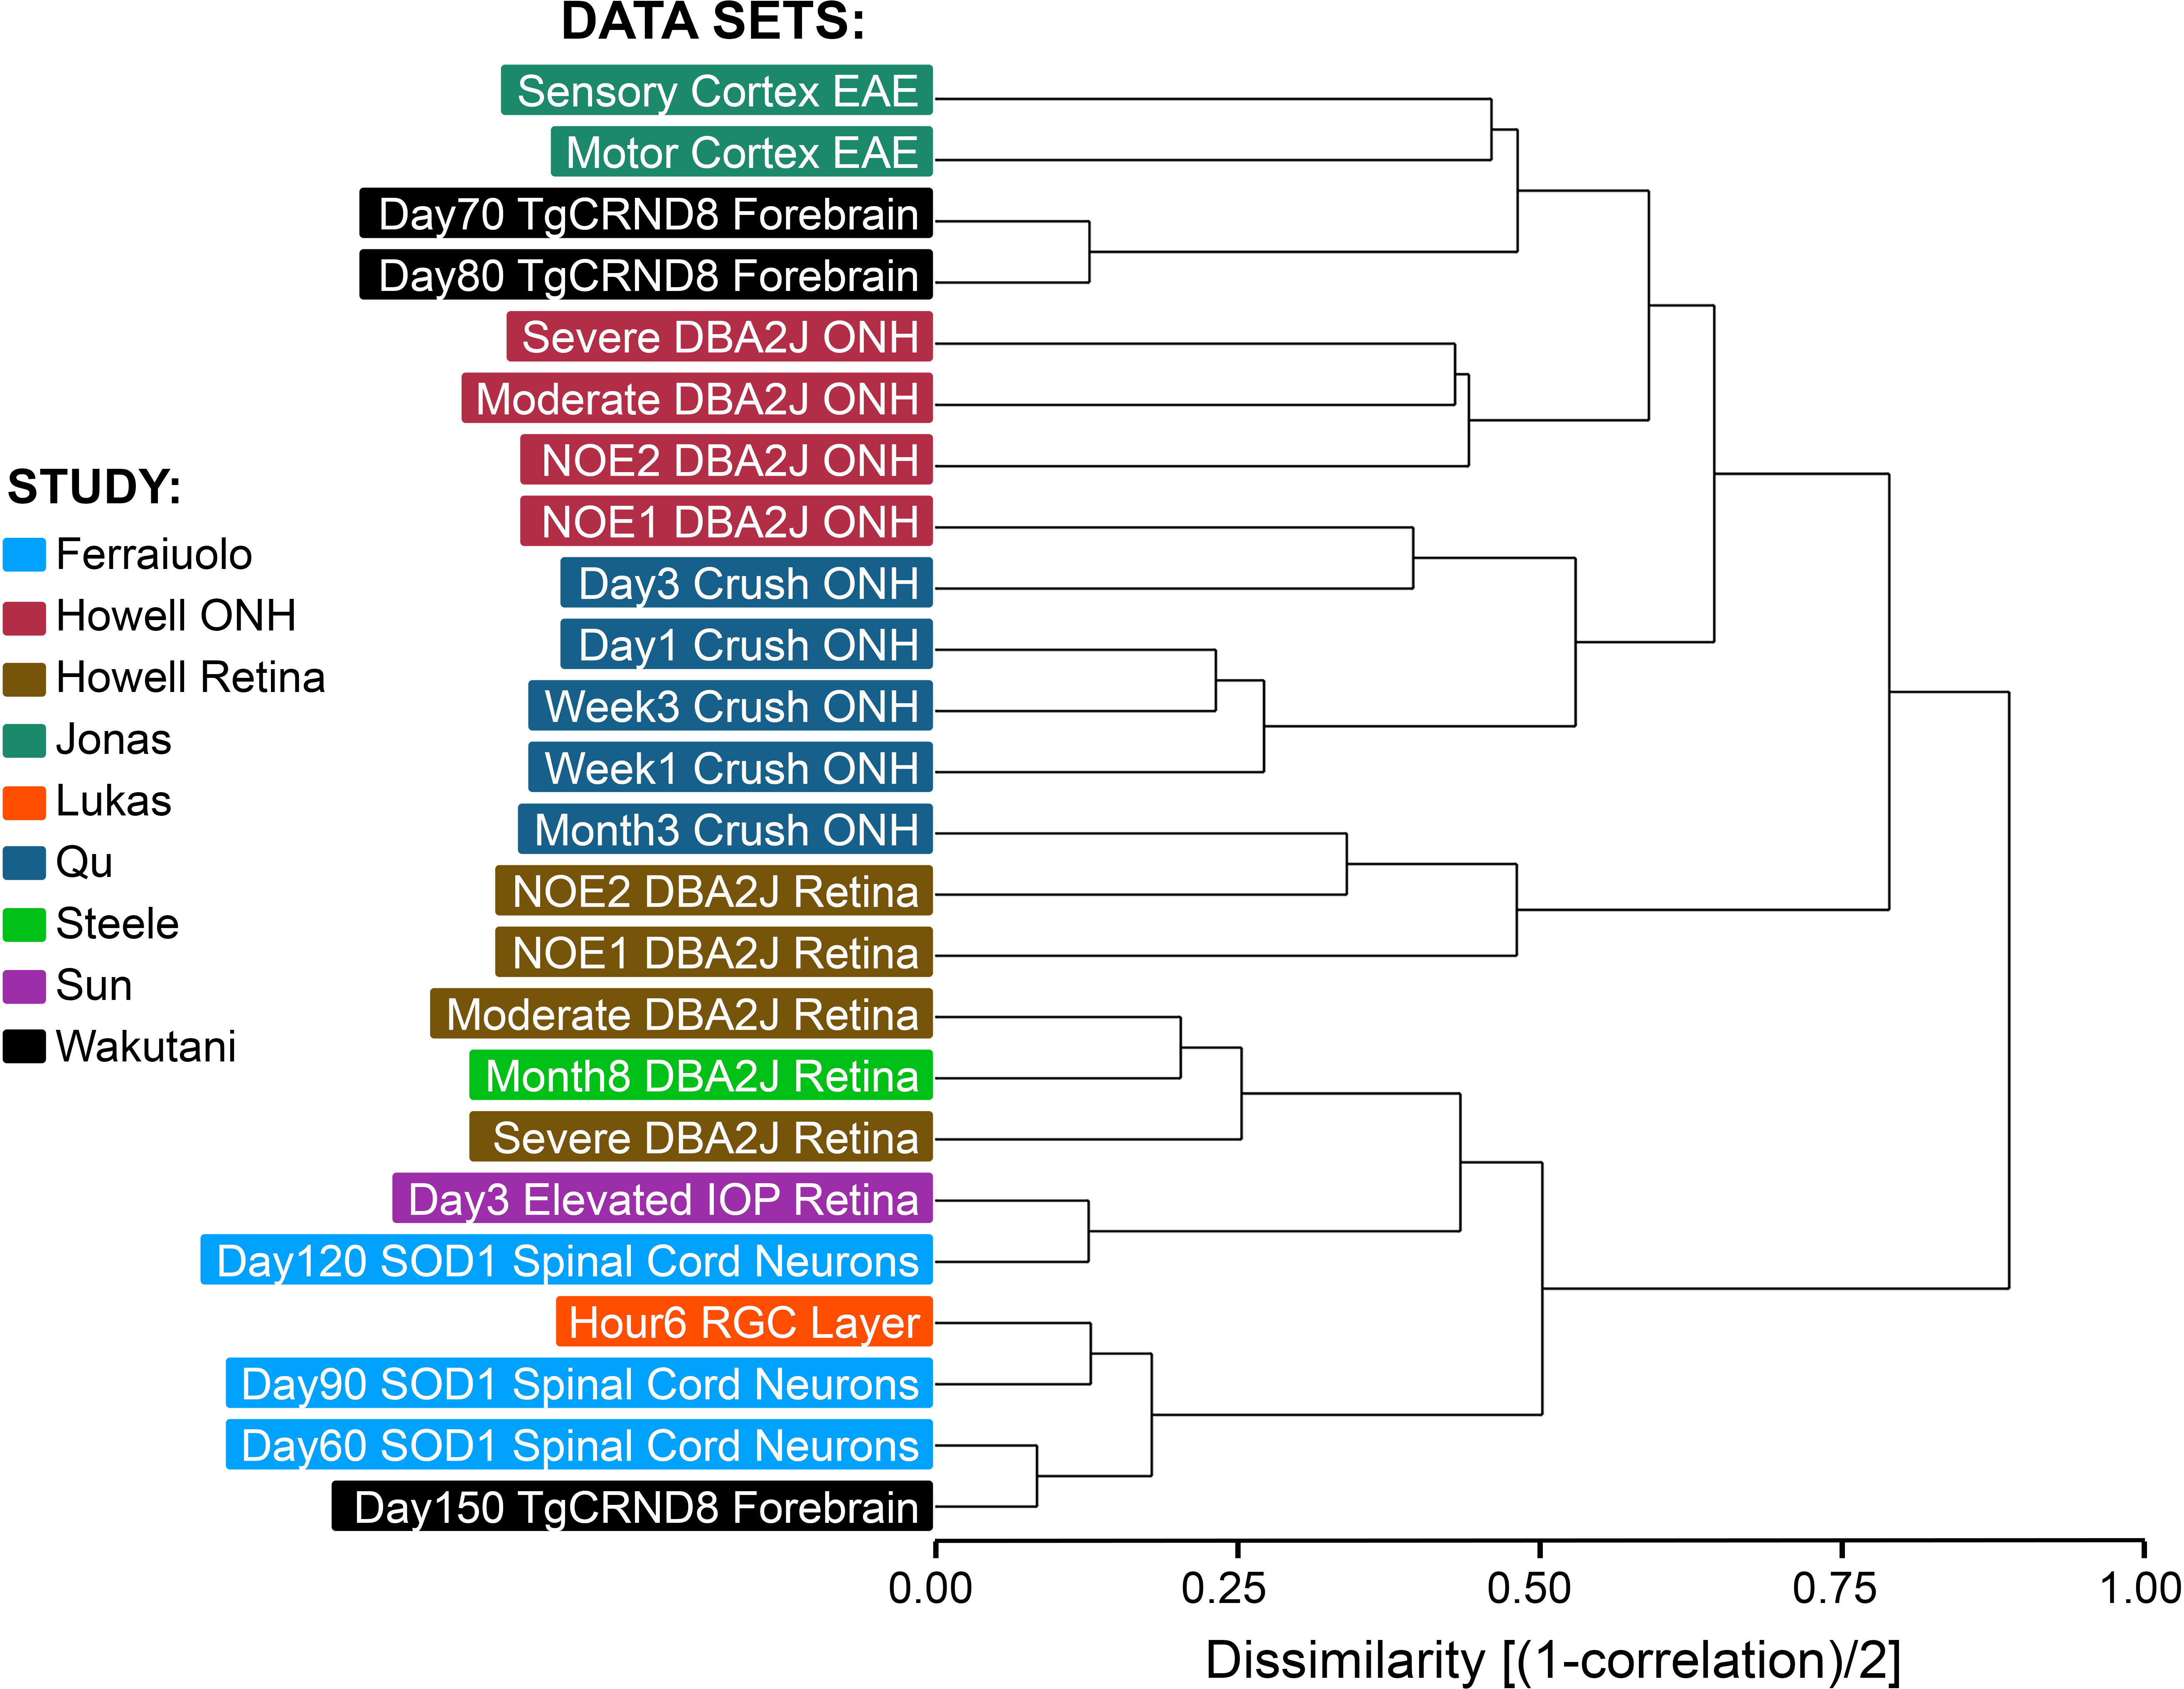
 Figure 3 of
Donahue, Mol Vis 2017; 23:987-1005.
Figure 3 of
Donahue, Mol Vis 2017; 23:987-1005.