Figure 2. Monte Carlo analysis of a pair-wise comparison of two data sets. The frequency distribution of outcomes from 10,000 Monte
Carlo simulations comparing the overlap of genes between two data sets (Agudo 48 h crush enriched genes and McCurley 4 day
crush enriched genes) observed by random chance (red bars). The number of genes shared by the two data sets in the empirical
data are actually 79. The p value is the proportion of simulations that produce several randomly shared genes that is greater
than, or equal to, the empirically observed number. In this comparison, the number of overlapping genes determined empirically
between the two compared data sets is significantly greater than what would be expected by random chance, and we declare this
to be a significant overlap for these data. Had the empirical data revealed 56 overlapping genes, then we would have declared
no significant overlap of the data sets (p>0.05).
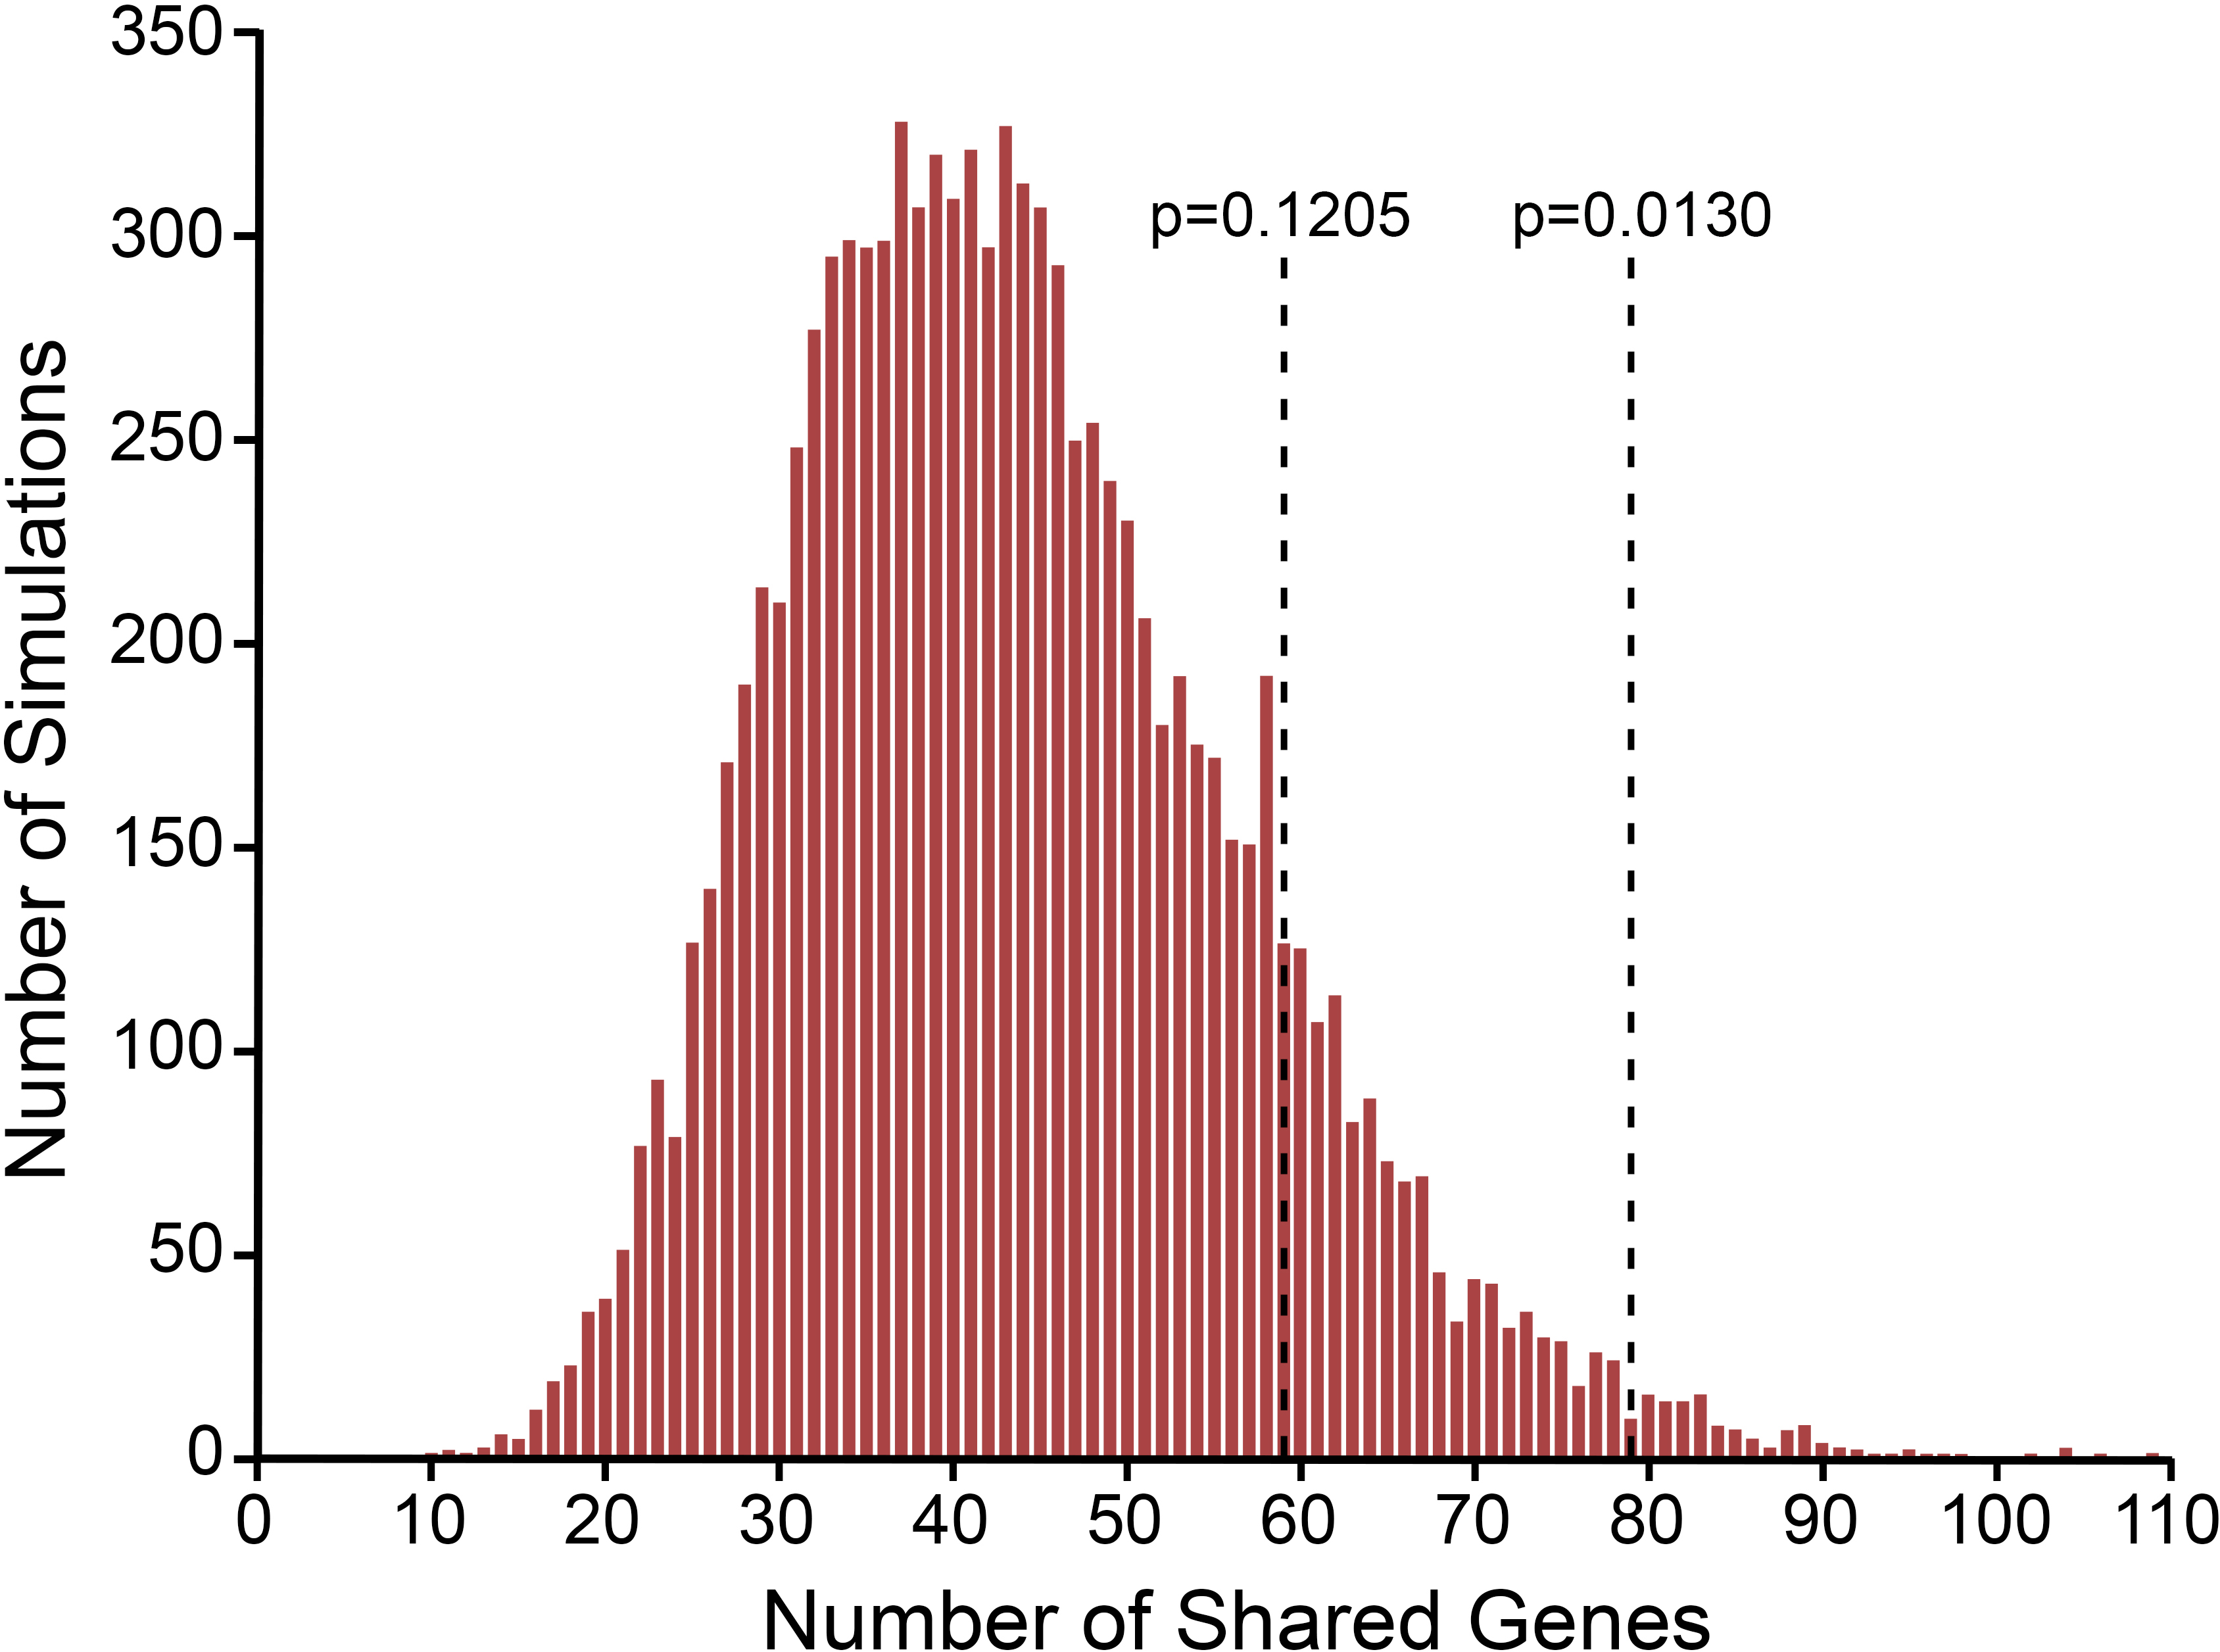
 Figure 2 of
Donahue, Mol Vis 2017; 23:987-1005.
Figure 2 of
Donahue, Mol Vis 2017; 23:987-1005.