Figure 4. Minocycline-associated changes in post-ischemic ON responses. A–C and E,F: Microglial (Iba1) and axonal (SMI 312) immunohistochemistry in the optic nerve (ON; Iba1: green; SMI 312: red). A: Naïve ON. Microglia are evenly distributed and ramified in appearance. SMI 312–positive axons are organized into bundles.
B: Vehicle-treated 3 days post-rodent nonarteritic anterior ischemic optic neuropathy (rNAION). Iba1-positive cells are relatively
ameboid (globular) in appearance and increased in number. C: Minocycline-treated, 3 days post-rNAION. Microglia are larger than in naïve eyes but ramified. D: Spectral domain-optical coherence tomography (SD-OCT) images of naïve and 30 days minocycline treatment rNAION eyes. Upper
panels: preinduction. The ON and the retina are labeled in the en face view shown in the left panels, while the retinal layers
are shown in the cross-sectional view shown in the right panels. There is an expansion of the space between the outer nuclear
layers on either side of the nerve in the same (minocycline treated) eye 2 days post-rNAION induction, when compared to the
upper (uninduced) panel). E and F: ON sections 30 days post-induction. E: Vehicle treated. Iba1-positive cells are globoid (reactive) in appearance (arrowheads). F: Minocycline treated. Iba1-positive microglia are abundant and large but ramified. E and F insets: SMI 312–positive reactivity in a low power view of the entire ON cross section of the vehicle- and minocycline-treated
nerves reveal a similar pattern of axonal loss. G–I: Nox2 expression in the anterior ON. G: Naïve animal. Little Nox2 expression is detectable. H: rNAION-induced, vehicle-treated nerve. Strong Nox2 expression is apparent. I: rNAION-induced, minocycline-treated nerve. Nox2 expression is detectable but reduced in the anterior ON. Scale bars in A, B, C, E, F, G: 50 μm. Scale bar in D: 200 μm. J: Densitometric analysis of Iba-1 signal strength shows statistically significantly increased Iba-1 signal when compared between
naïve and vehicle-treated animals (1.50±0.15 standard error of the mean (SEM) versus 7.08±0.54 SEM, six animals per group),
as well between naïve and minocycline-treated (6.72±0.97 SEM, six animals per group) animals (asterisks indicate statistical
significance); the difference in Iba-1 staining when vehicle- versus minocycline-treated animals are compared is not statistically
significant (ANOVA; f-ratio = 0.11571, p=0.74154). K: Densitometric analysis comparing naïve (white bar) 11.5±1.20 SEM, vehicle-treated (black bar) 17.07±1.50 SEM, and minocycline-treated
(hatched bar) 10.06±0.61 SEM (ANOVA; f-ratio = 10.51066. p=0.014213; 6.72±0.97 SEM, six animals per group) animals (asterisks
indicate statistical significance). L: rNAION upregulation of free radicals and their downregulation by minocycline demonstrated by the MitoSOX Red reaction: naïve
(white bar) 5.6±3.4 SEM, vehicle-treated (black bar) 87.60±20.34 SEM, and minocycline-treated (hatched bar) 27.0±19.9 SEM
(ANOVA; f-ratio = 9.05275, p=0.023738). Asterisks indicate statistical significance.
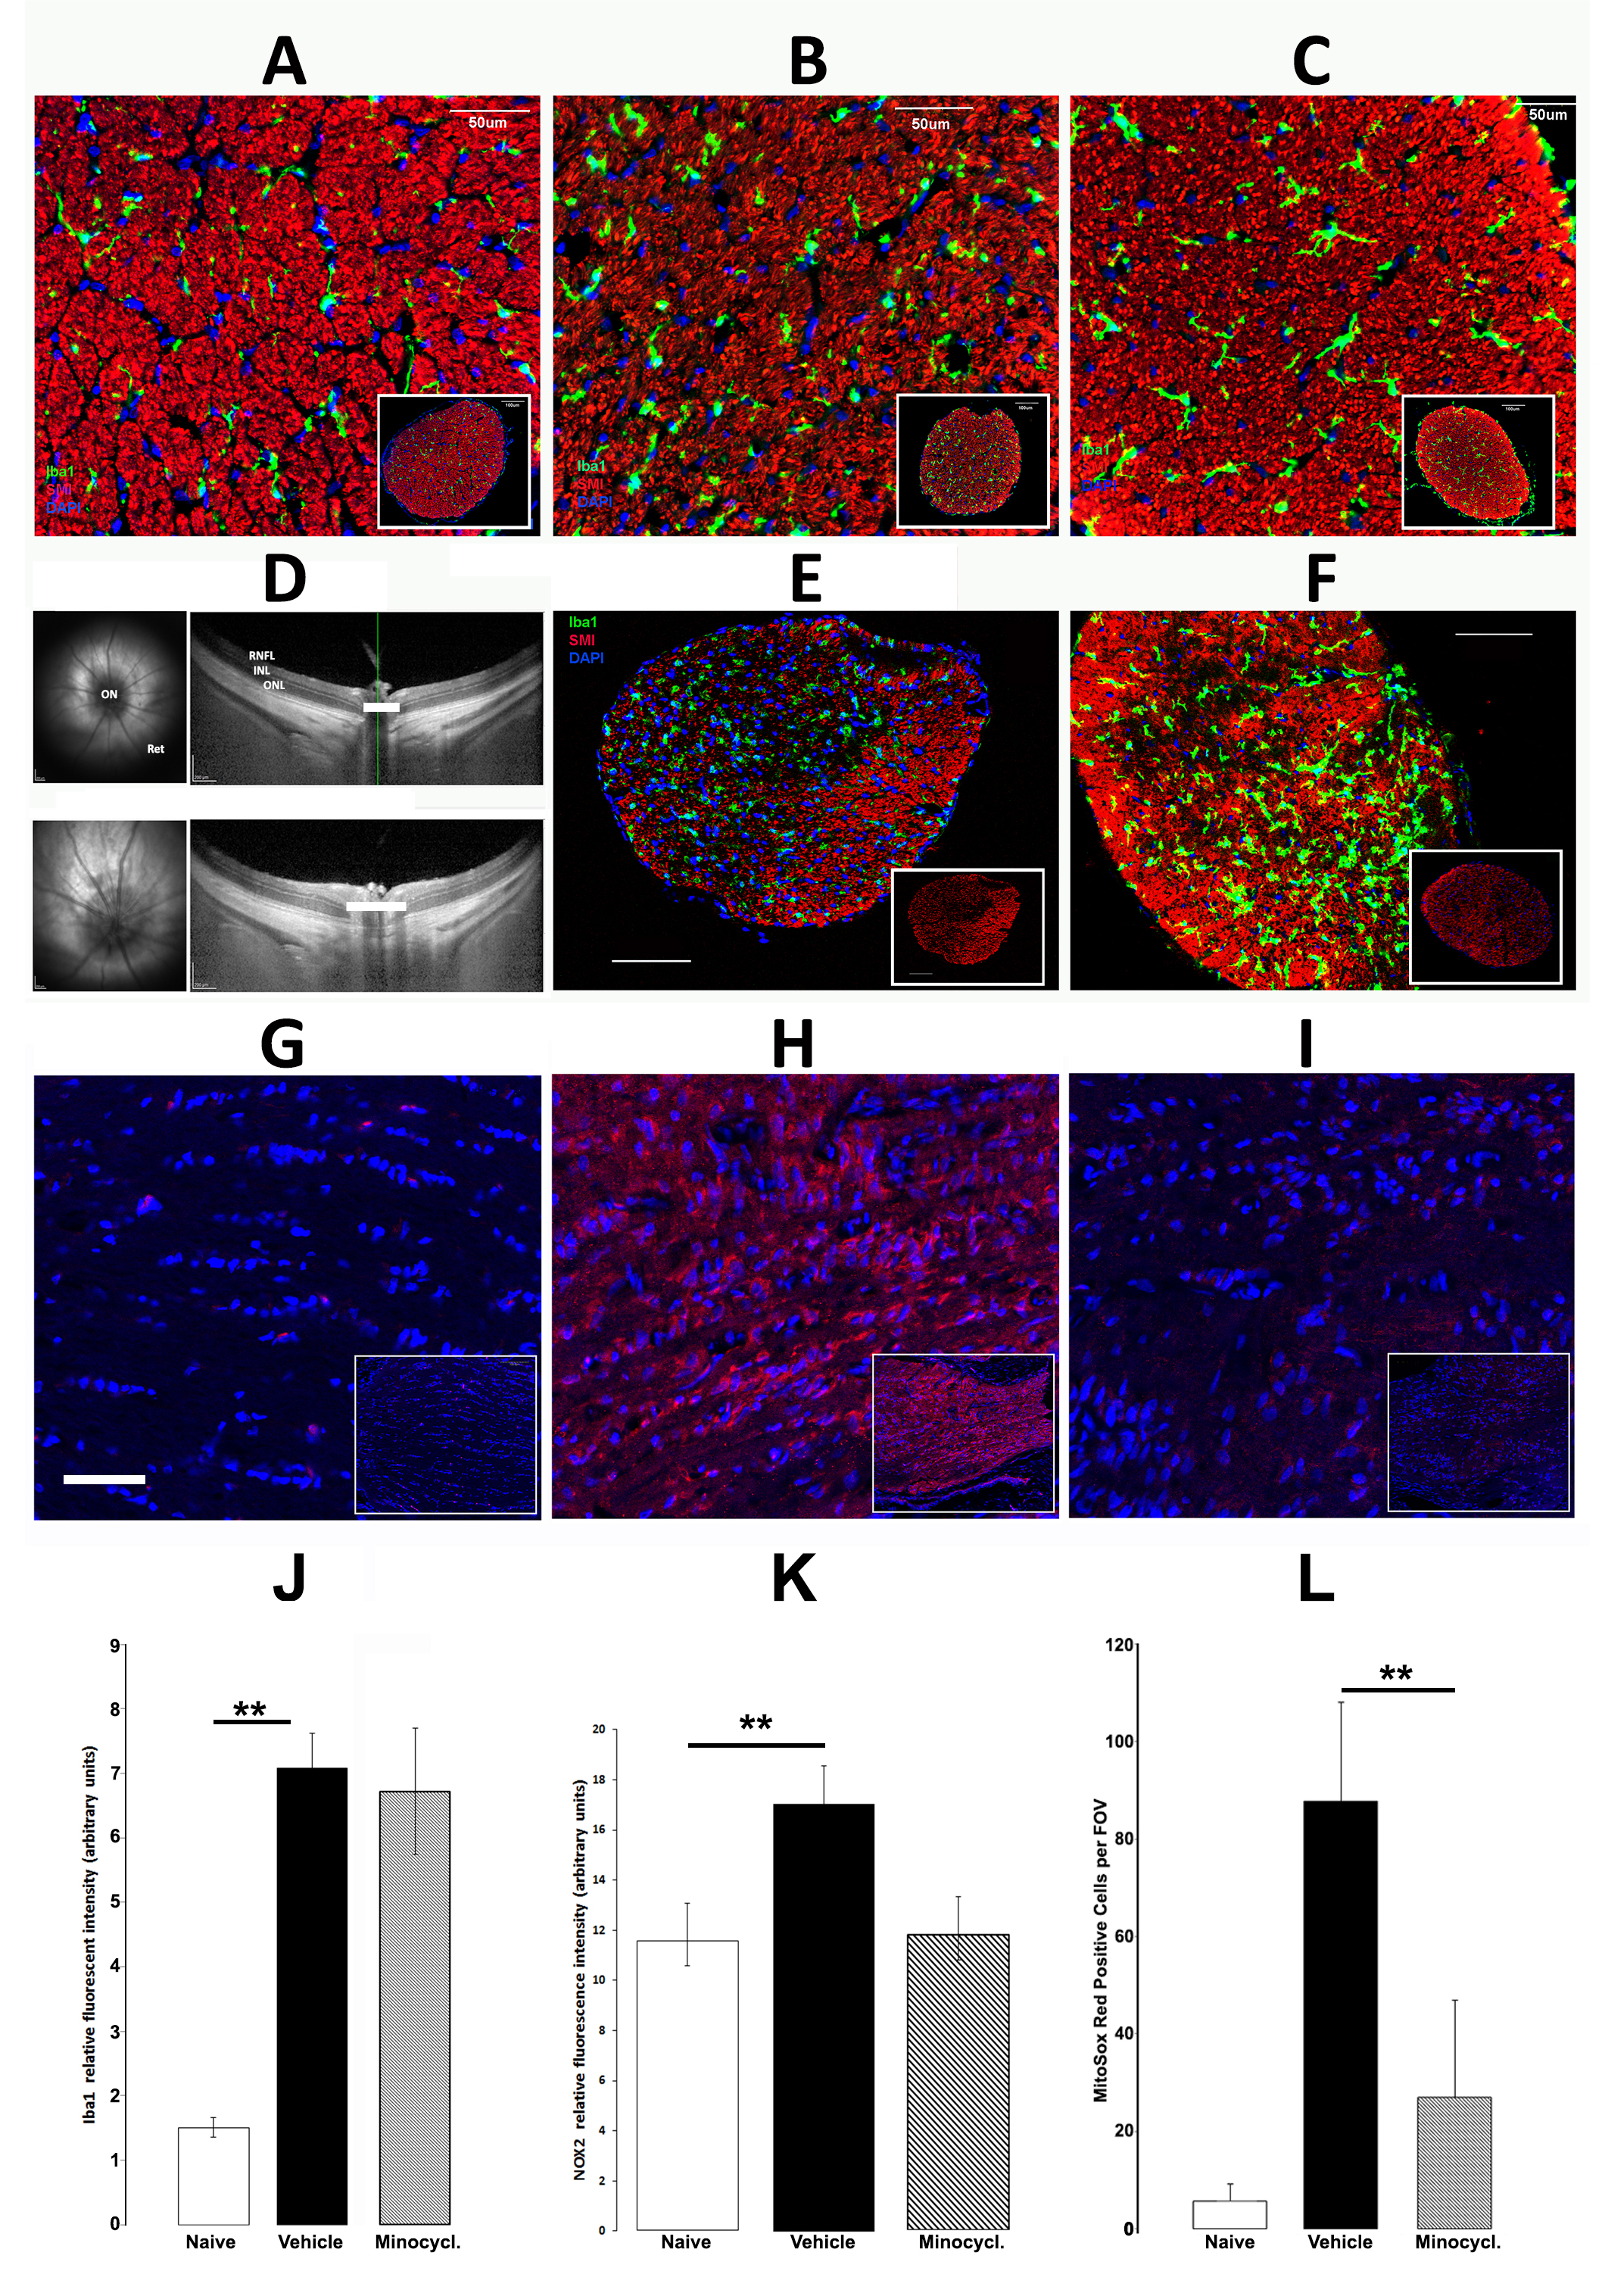
 Figure 4 of
Mehrabian, Mol Vis 2017; 23:963-976.
Figure 4 of
Mehrabian, Mol Vis 2017; 23:963-976.