Figure 1. Analysis of axonal neurofilaments and myelination in control and rNAION-induced (30 days post-induction) ON. A,B: SMI 312 (neurofilament) and MBP (myelin) immunostaining in the control rat optic nerve (ON; A) and 30 days post-induction (B). SMI 312 immunoreactivity is seen in red. MBP is shown in green. Arrowheads indicate complete myelination (in green) of
individual axons. The axonal dropout and loss of normal myelin signal and structure are typical for optic nerves following
ON ischemia (B inset). Scale bar (inset: 100 μm). C,D: Transmission electron microscope (TEM) imaging of tissues seen in A and B. C: Control ON. TEM reveals normally myelinated axons of various calibers (arrows indicate relative ratios of myelination in
large, medium and small axons). D: Rodent nonarteritic anterior ischemic optic neuropathy (rNAION)-induced ON. In contrast to the control ON, there are myelin
loss, hypomyelination, and poorly compacted myelin (arrows) in the remaining axons 30 days after induction. Magnification
= 2,100X. Scale bar: 2 μM. E,F: ON ischemia-induced gliosis in the anterior ON. E: Control ON. Anti-GFAP antibody (1:20,000 dilution) shows minimal staining in normal tissue (scale bar = 50 μm). Inset shows
low magnification (scale bar: 200 μm). F: Post-rNAION. Strong GFAP signal is present in the anterior ON region 30 days post-induction, reflecting upregulation of
astrocyte-based reactive gliosis.
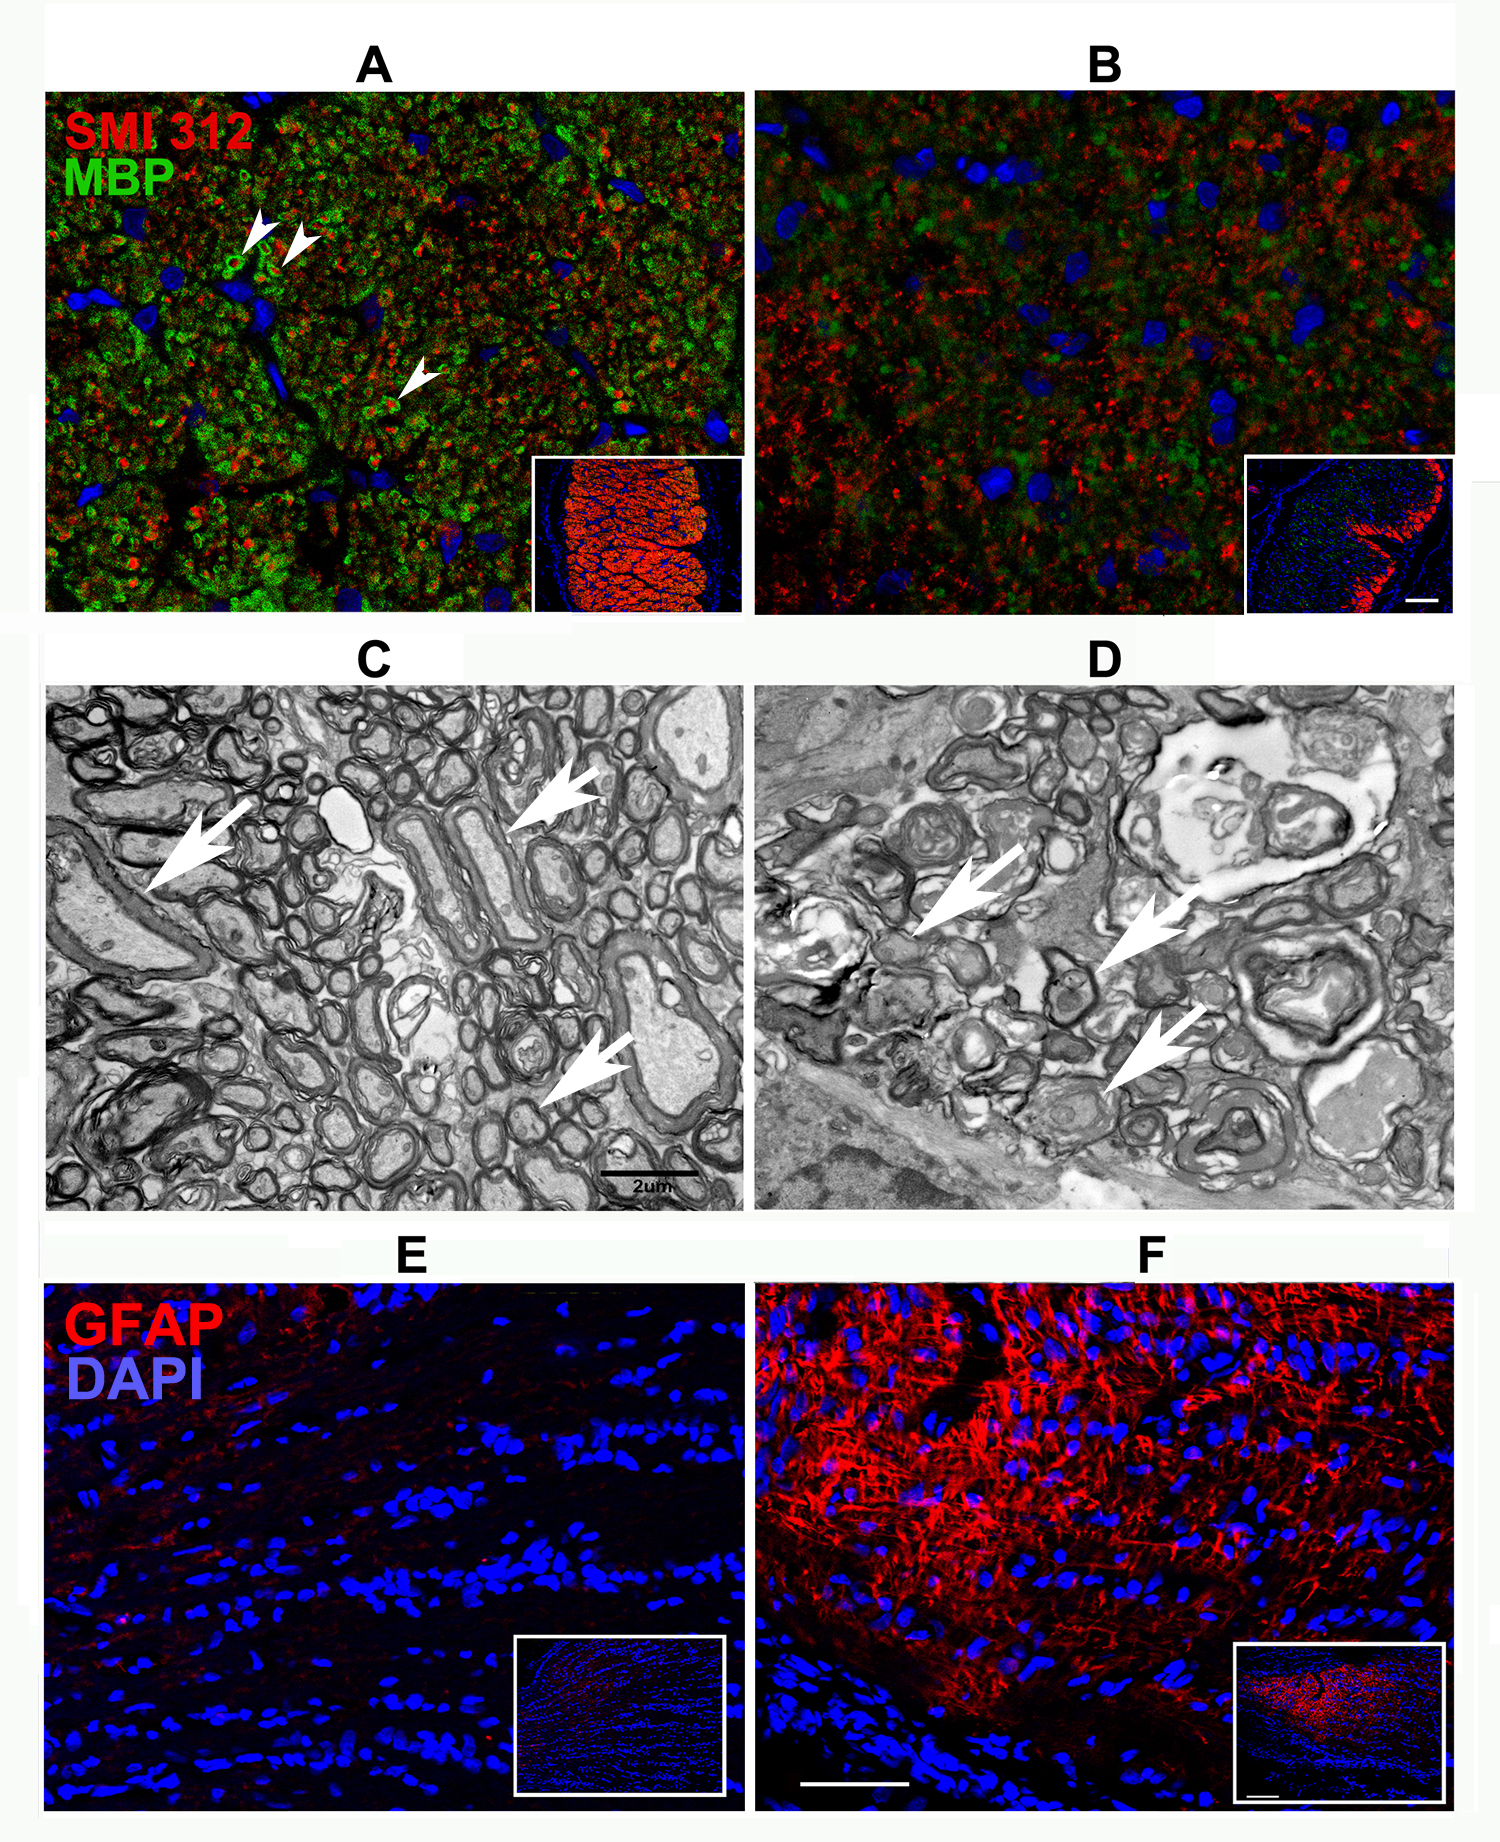
 Figure 1 of
Mehrabian, Mol Vis 2017; 23:963-976.
Figure 1 of
Mehrabian, Mol Vis 2017; 23:963-976.