Figure 5. The effect of DNase I treatment on extracellular citrullinated DNA. Number of citrullinated histone 3 (H3Cit) loci with and
without DNase I treatment in the anterior and posterior chambers of interleukin (IL)-8 (A) and tumor necrosis factor alpha (TNF-α) (B). *Statistically significant; p<0.05, ** highly significant, p<0.001.
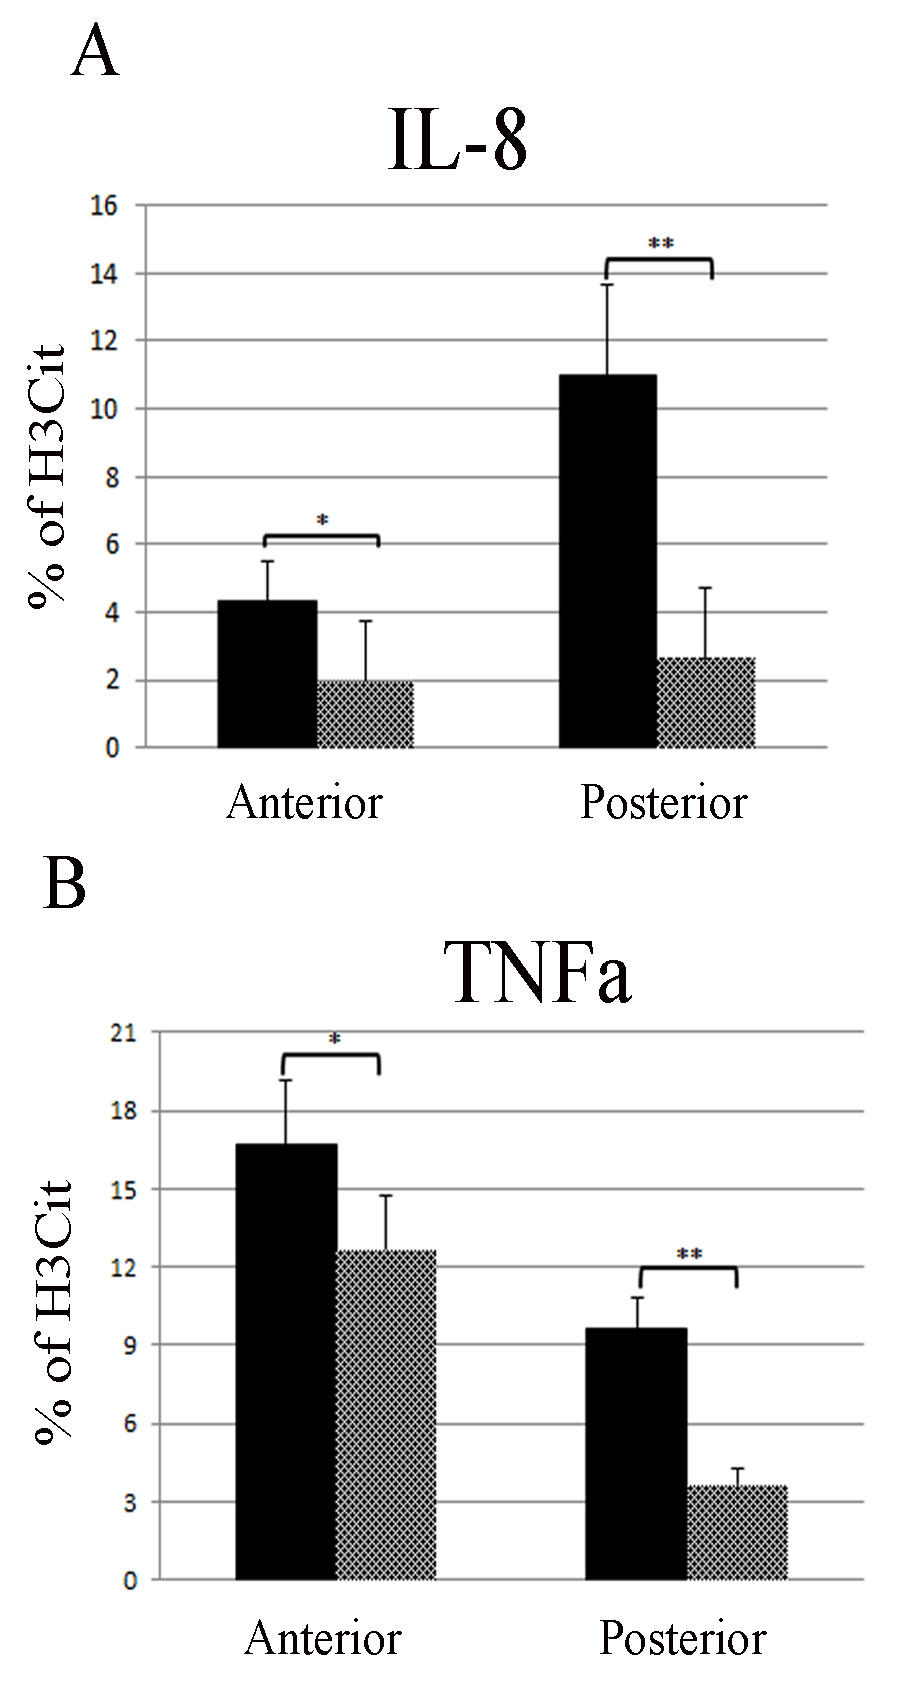
 Figure 5 of
Barliya, Mol Vis 2017; 23:922-932.
Figure 5 of
Barliya, Mol Vis 2017; 23:922-932.