Figure 3. Changes in MG pCREB levels during retinal degeneration. Retinas from wild-type (A) and rd10 (B) mice were stained for pCREB (green), SOX9 (red) to label Müller glia (MG) and 4',6-diamidino-2-phenylindole (DAPI; blue)
to label the nuclei. C: Phospho-CREB levels were quantified in MG and non-Müller glia (NMG) in the retinas from the wild-type and rd10 mice as described in the Methods. The pCREB levels in MG in the rd10 mice were lower compared with those in the NMG. In contrast, the pCREB levels were equal to or slightly higher than the levels
in NMG in the wild-type mice. D: A time course of the ratio of pCREB (MG/NMG) demonstrates that pCREB in the MG is lower at all points in the rd10 mice compared with the wild-type mice. pCREB appeared to decrease in the rd10 mice during the progression of retinal degeneration, followed by an increase toward wild-type levels at P34. The data are
representative of three separate experiments on two sets of wild-type and three sets of rd10 mice. The pattern of transient reduction in the pCREB levels in MG was consistent between experiments. Anti-SOX9 conjugated
to CF555 (see Methods), final antibody concentration, 1:2,000; anti-pCREB conjugated to Alexa Fluor 488A (anti-pCREB-Alexa
Fluor 488 conjugate); final antibody concentration; 1:25. A single z slice is presented for each image. The levels of pCREB
were quantified as described in the Methods. Error bars represent the standard error of the mean (SEM). For statistical comparisons,
a one-way ANOVA was performed using Sidak’s multiple comparisons test in C, D. *p<0.01; **p<0.0001. Scale bar = 50 μm. Although the pCREB ratio between the rd10 mice retinas at P34 and the wild-type mice retinas at P36 was statistically significant (p = 0.0144), these data were not
included because the trend of the rd10 data made it difficult to assess what the levels would be on P36. Abbreviations: ONL, outer nuclear layer; INL, inner nuclear
layer; IPL, inner plexiform layer.
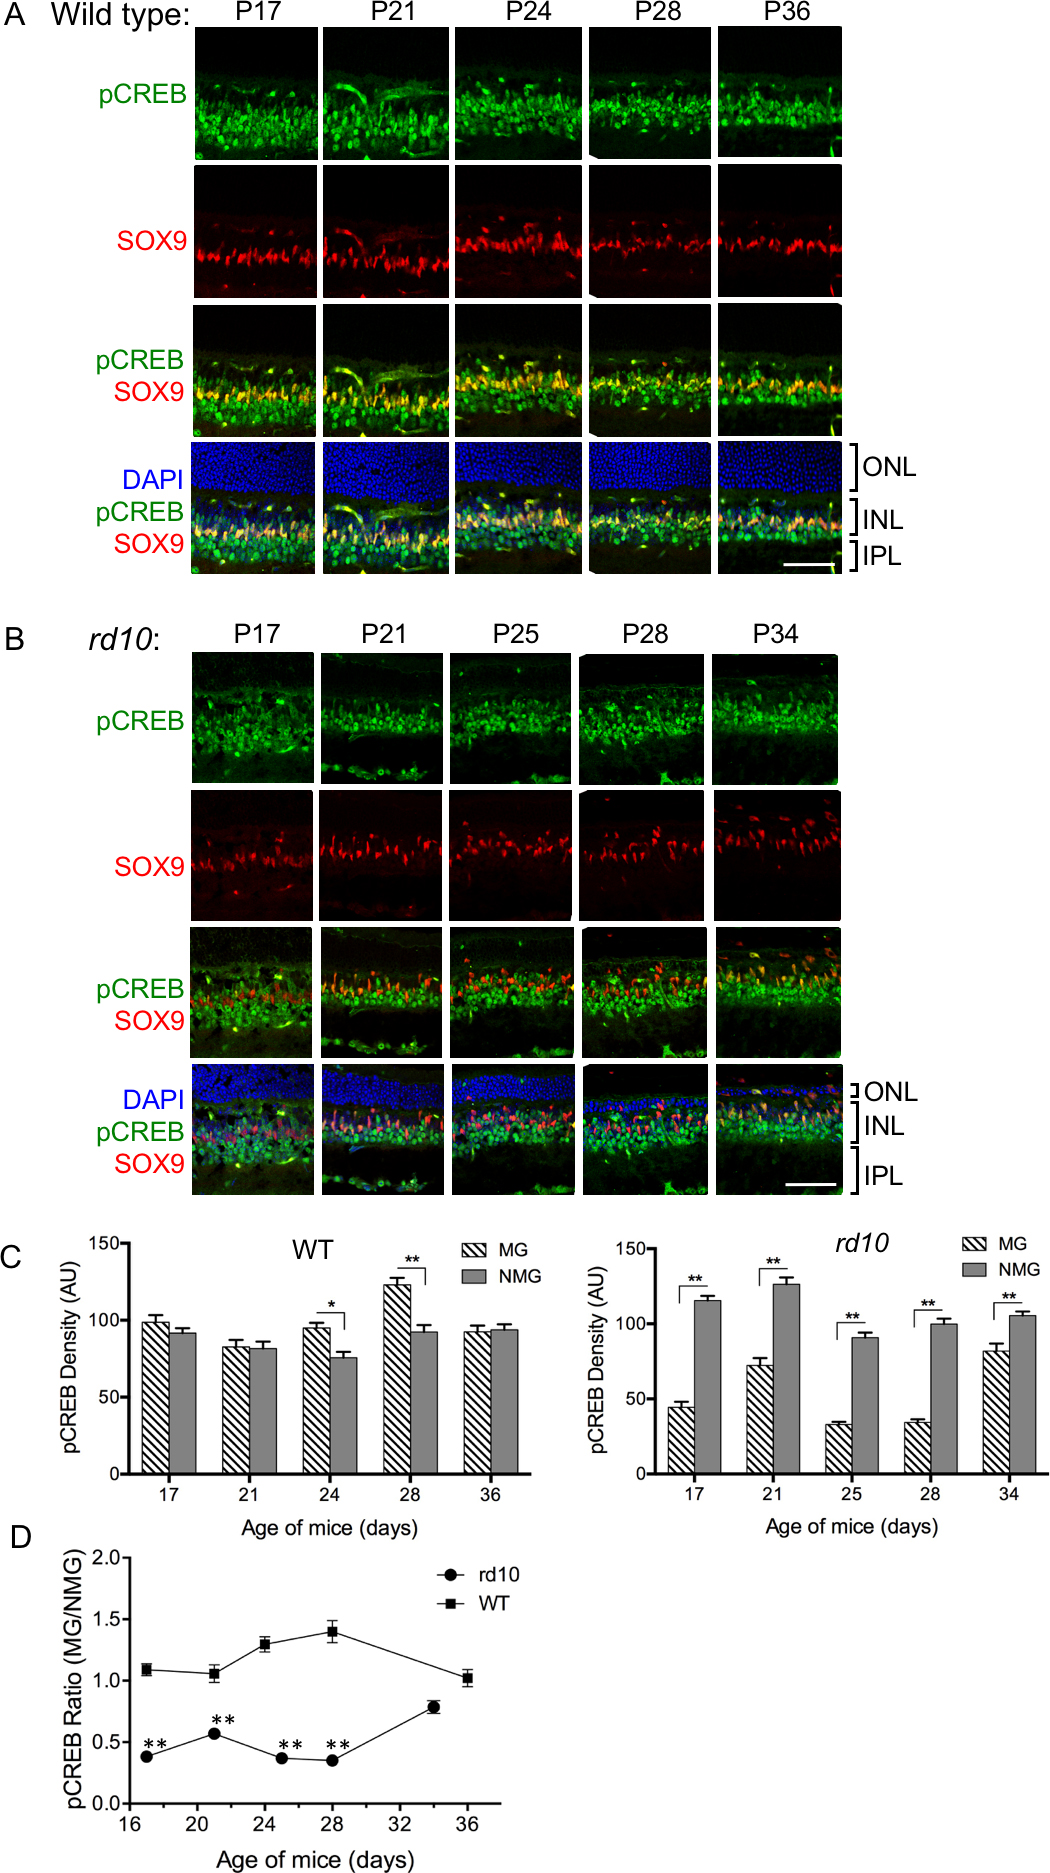
 Figure 3 of
Dong, Mol Vis 2017; 23:90-102.
Figure 3 of
Dong, Mol Vis 2017; 23:90-102.