Figure 4. Quantification of reactive oxygen species (ROS) level. Oxidative stress level was compared between treated and control macrophages
via ROS measurements. ROS levels in M1 and M2 macrophages are shown in panels A and B, respectively. ROS levels were normalized to the untreated macrophages of the same patient (n=3; *=p<0.05). The y-axis indicates
the relative fluorescent intensity ± SEM.
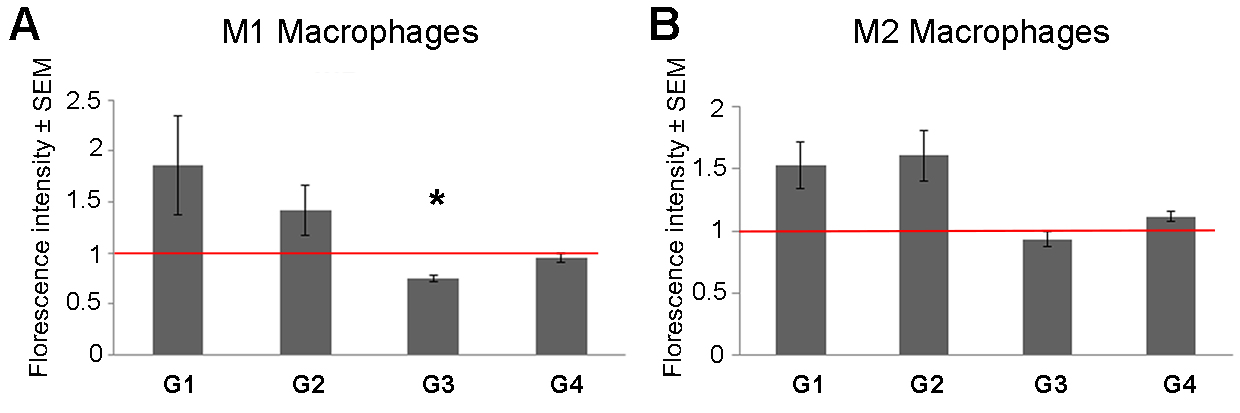
 Figure 4 of
Rinsky, Mol Vis 2017; 23:889-899.
Figure 4 of
Rinsky, Mol Vis 2017; 23:889-899.