Figure 3. Protein expression profile of macrophages treated with antioxidant supplements. Proteins expression levels were measured in
activated human macrophages treated with the five different experimental groups (G1–G5) using ELISA. A comparison between
the different treatment groups was performed using a multivariate and parametric analysis (ANOVA test). Expression of interleukin
6 (IL-6) and C-C Motif chemokine ligand 2 (MCP1/CCR2) from M1 and MCP1 and tumor necrosis factor α (TNFα) from M2 are shown in panels A–B and C–D, respectively. Protein expression of macrophages treated with supplements was compared to DMSO-treated macrophages from each
patient (+=p<0.05) and between experimental groups (*=p<0.05, **=p<0.01, ***=p<0.0001; n=10). The y-axis indicates RQ ± SEM
relative to the gene expression of the control group.
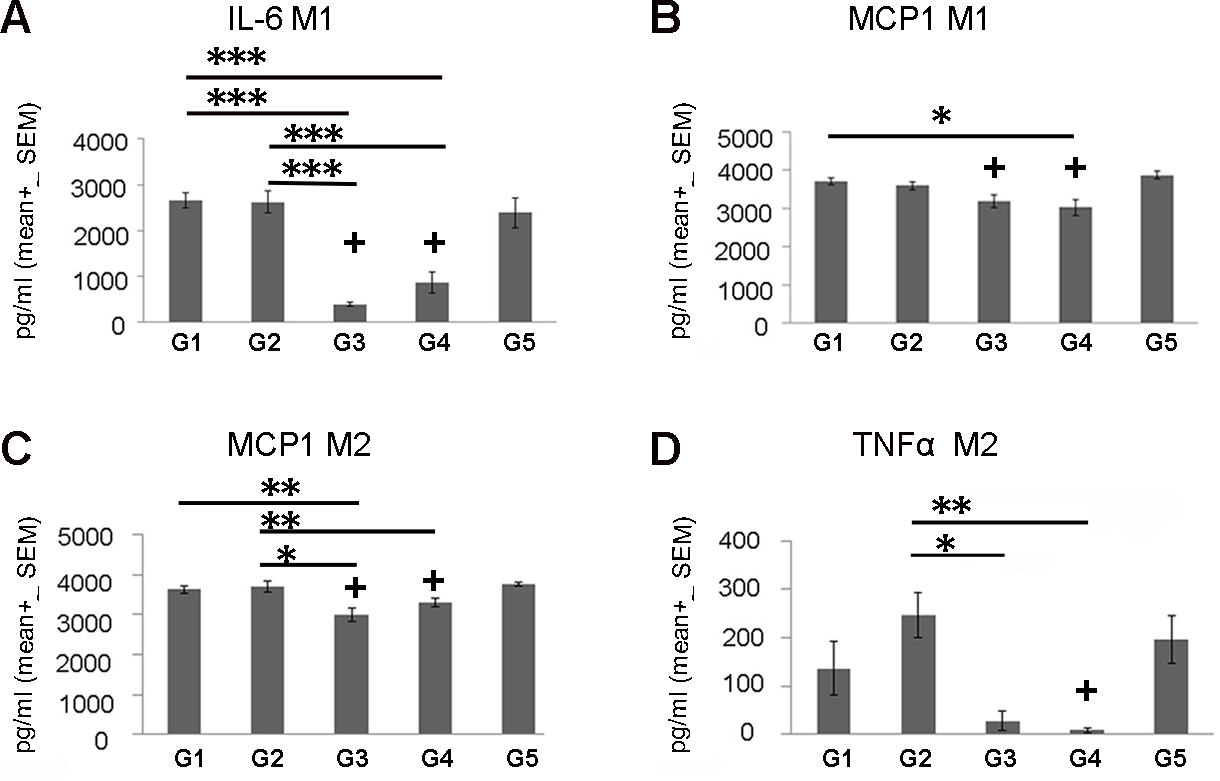
 Figure 3 of
Rinsky, Mol Vis 2017; 23:889-899.
Figure 3 of
Rinsky, Mol Vis 2017; 23:889-899.