Figure 2. Gene expression profile of macrophages treated with antioxidant supplements. mRNA expression levels were measured in activated
human macrophages treated with the five different experimental groups (G1–G5) using QPCR. A comparison between the different
treatment groups was performed using a multivariate and non-parametric analysis (Kruskal–Wallis test). Expression of inositol-3-phosphate
synthase 1 (ISYNA1), superoxide dismutase 1 (SOD1), and heme oxygenase 1 (HMOX1) of M1 and M2 are shown in panels A–C and D–F, respectively. Expression of catalase (CAT), glutathione peroxidase 1(GPX1), and vascular endothelial growth factor α (VEGFa) of M2 macrophages are shown in panels G–I, respectively. Gene expression of macrophages treated with supplements was compared to DMSO-treated macrophages from each
patient (+=p<0.05) and between experimental groups (*=p<0.05, **=p<0.01, ***=p<0.0001; n=10). The y-axis indicates RQ ± SEM
relative to the gene expression of the control group.
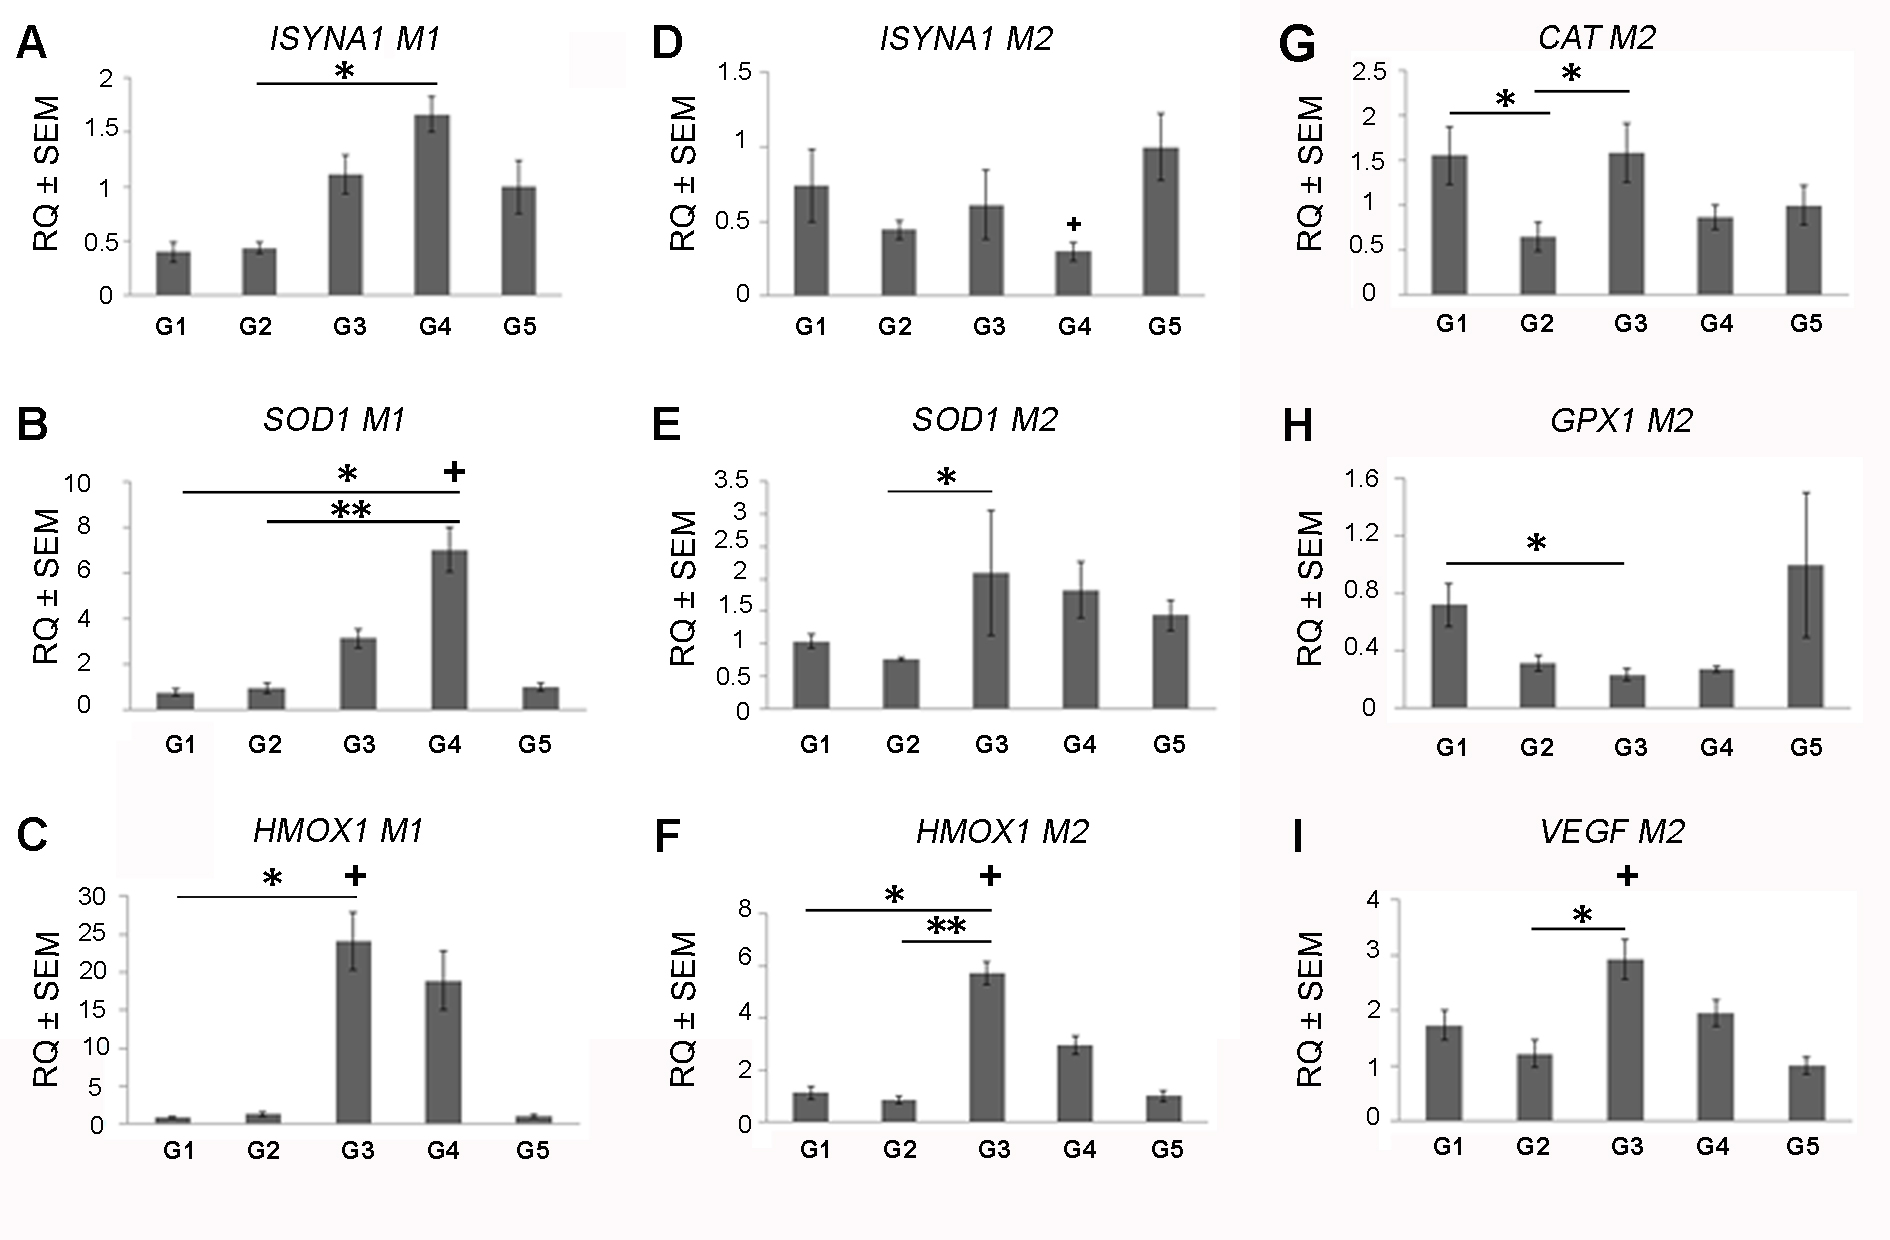
 Figure 2 of
Rinsky, Mol Vis 2017; 23:889-899.
Figure 2 of
Rinsky, Mol Vis 2017; 23:889-899.