Figure 1. Validation of macrophage polarization. QPCR was done using markers for the phenotype of M1 and M2 macrophages. Panels A and B show expression levels of tumor necrosis factor α (TNF α) and interleukin 12 (IL-12) markers for M1 polarization, while Panel C shows expression levels of mannose receptor C-type 1(MRC1), a marker for M2 polarization. Accordingly, M1 macrophages showed higher mRNA levels of TNFα and IL-12 compared with M2 macrophages (A, B). M2 macrophages demonstrated increased mRNA levels of MRC1 compared with M1 cells (C). *=p<0.01. Panel D indicates M1 macrophage morphology via inverted microscope at 40x magnification, and Panel E indicates M2 macrophage morphology.
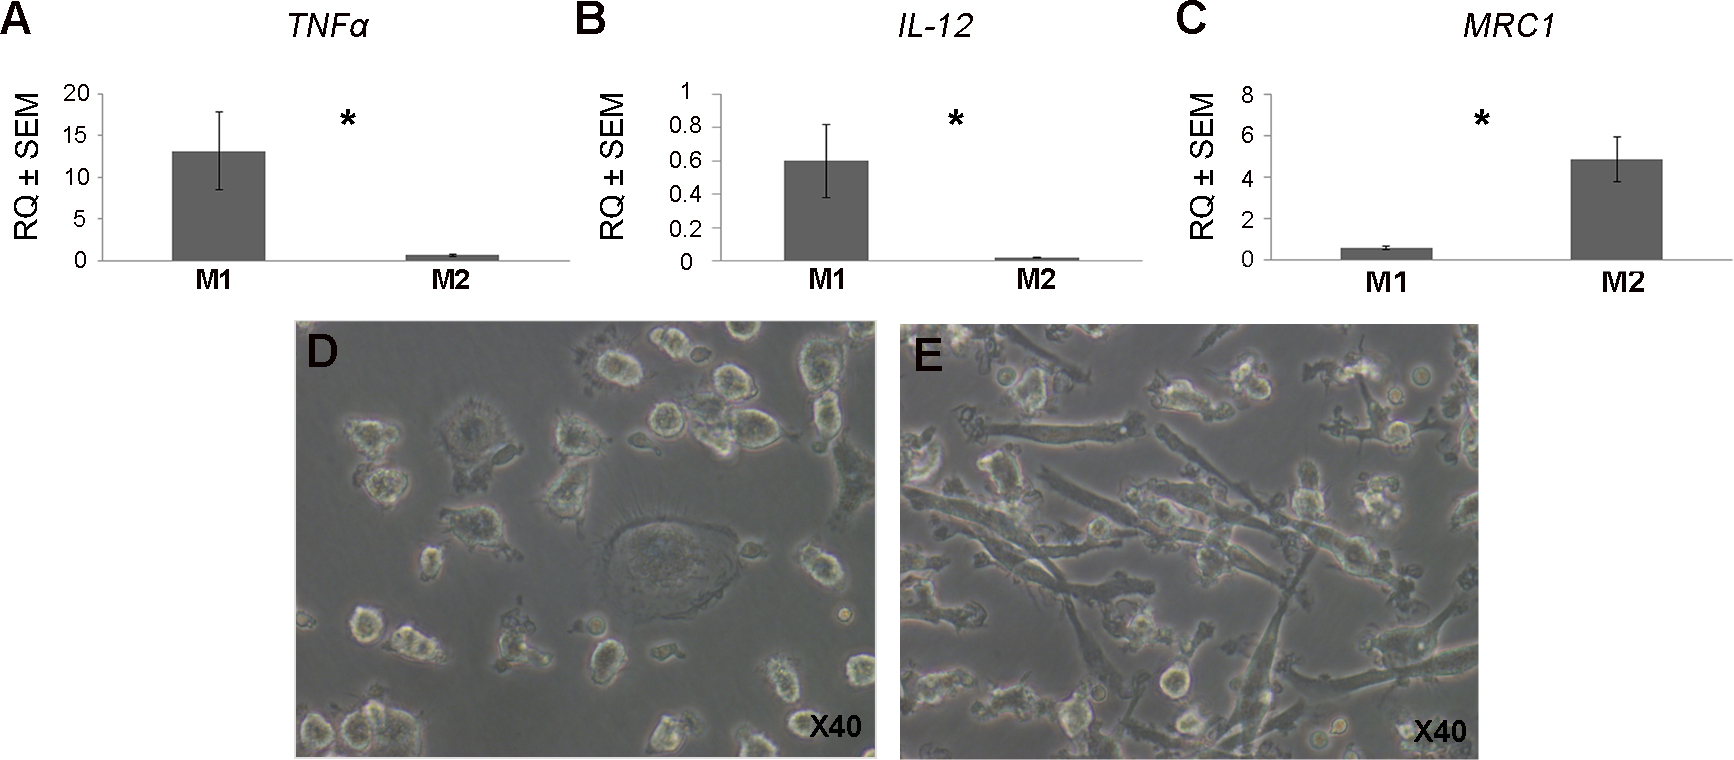
 Figure 1 of
Rinsky, Mol Vis 2017; 23:889-899.
Figure 1 of
Rinsky, Mol Vis 2017; 23:889-899.