Figure 5. Leading-edge subset proteins from the Human Phenotype Ontology gene sets implicated at 6 h. The heat map shows the leading-edge
proteins from the four gene sets that were significantly enriched at the top or bottom of the protein list ranked by correlation
with refraction at 6 h (abnormal electroretinogram, nyctalopia, photophobia, and arrhythmia). Heat map intensity values are
plotted below the corresponding refraction measure for each sample. The panels to the right show the correlation of individual
proteins with refraction, and provide further information on phenotype and disease associations (as listed in the Human Phenotype
Ontology database; human-phenotype-ontology.github.io/). CCM = congenital cataract-hypertrophic cardiomyopathy-mitochondrial
myopathy syndrome, MELAS = mitochondrial myopathy, encephalopathy, lactic acidosis, and stroke-like episodes, FARPA = fundus
albipunctatus retinitis punctata albescens.
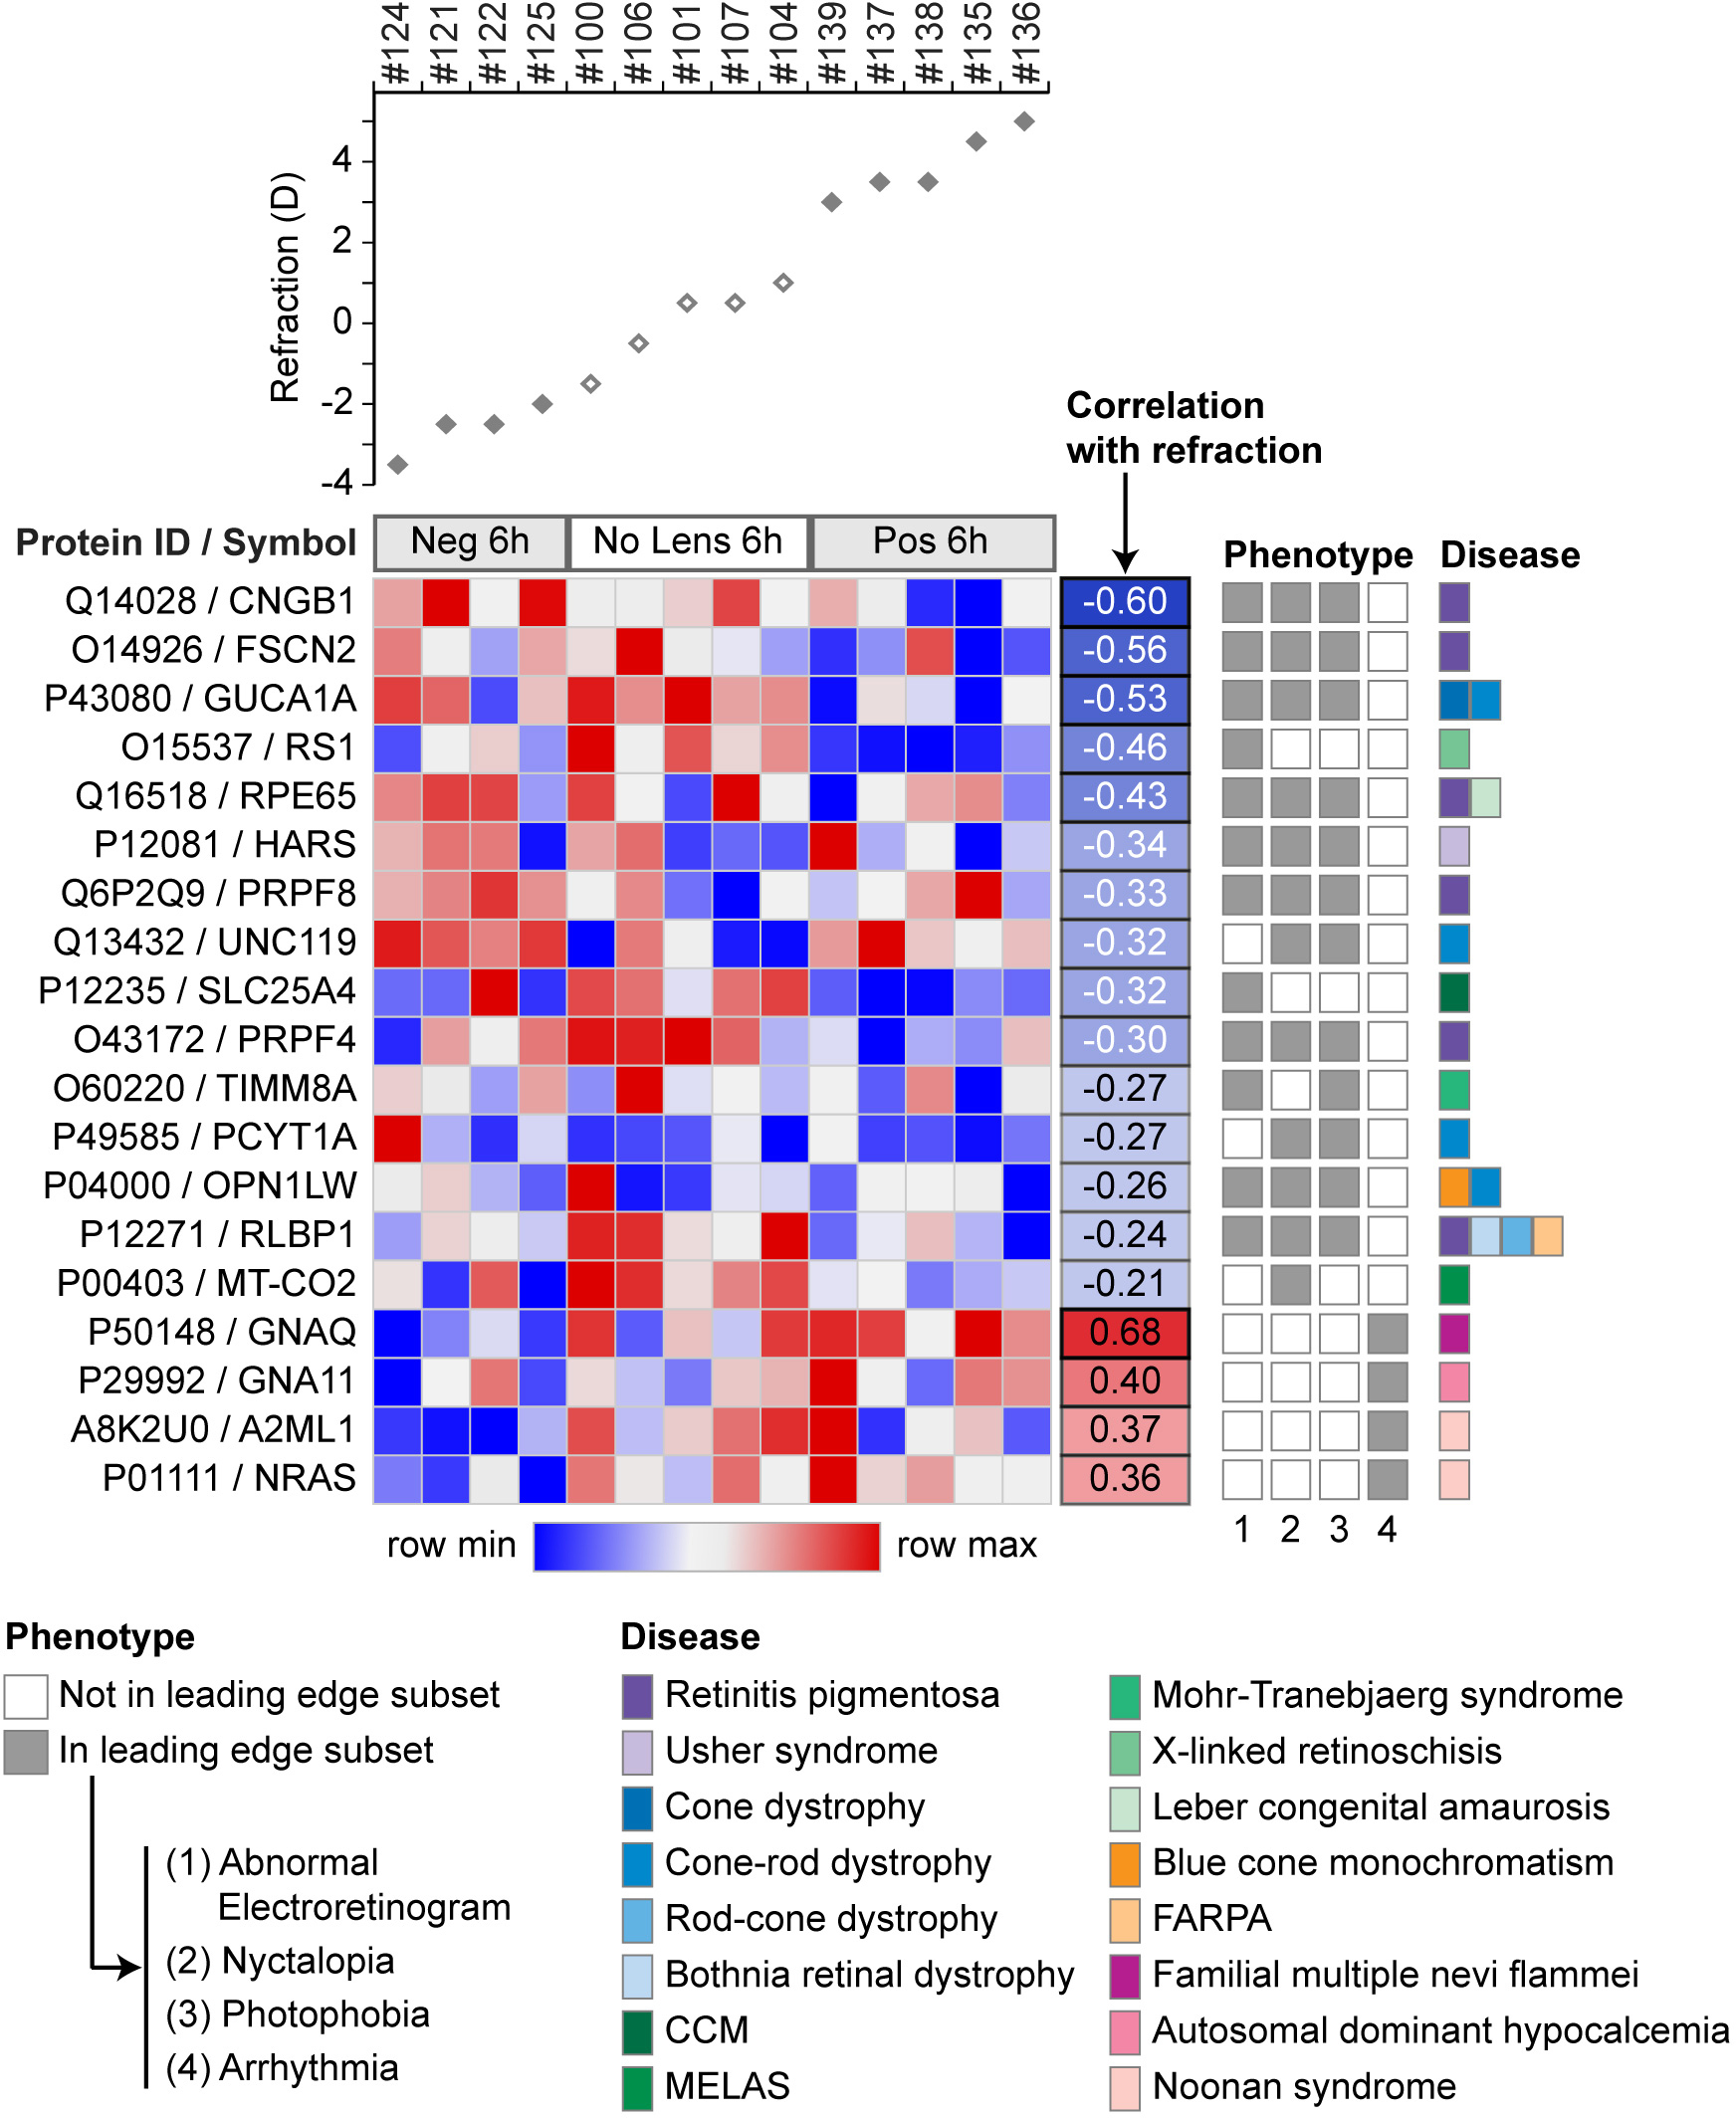
 Figure 5 of
Riddell, Mol Vis 2017; 23:872-888.
Figure 5 of
Riddell, Mol Vis 2017; 23:872-888.