Figure 3. Comparison of differentially abundant proteins with previous exploratory proteomic and transcriptome studies of refractive
error. A: Chord diagram showing the 11 proteins that were differentially abundant in the present study and differentially abundant
in previous proteomic studies. B: Chord diagram showing the 12 proteins that were differentially abundant in the present study and differentially expressed
in previous meta-analyses of chick refractive error transcriptome studies. C: Chord diagram showing the 55 proteins that were differentially abundant in the present study and differentially expressed
in previous transcriptome studies. The fold change of individual proteins in the present study is shown on the left side of
each chord diagram, with the position in the annulus indicating the condition. Previous studies implicating the same protein
and gene are shown on the right. Protein contributions to the most significant ontology over-representations (melanin biosynthetic
process and axonogenesis) are indicated with symbols. Appendix 2 and Appendix 8 provide further details on all previous studies
included in these comparisons. Neg = negative lens, Pos = positive lens, h = hours, d = days, w = weeks, m = months, LIH =
lens-induced hyperopia, LIM = lens-induced myopia, FDM = form deprivation myopia, LIMR = LIM recovery, FDMR = FDM recovery.
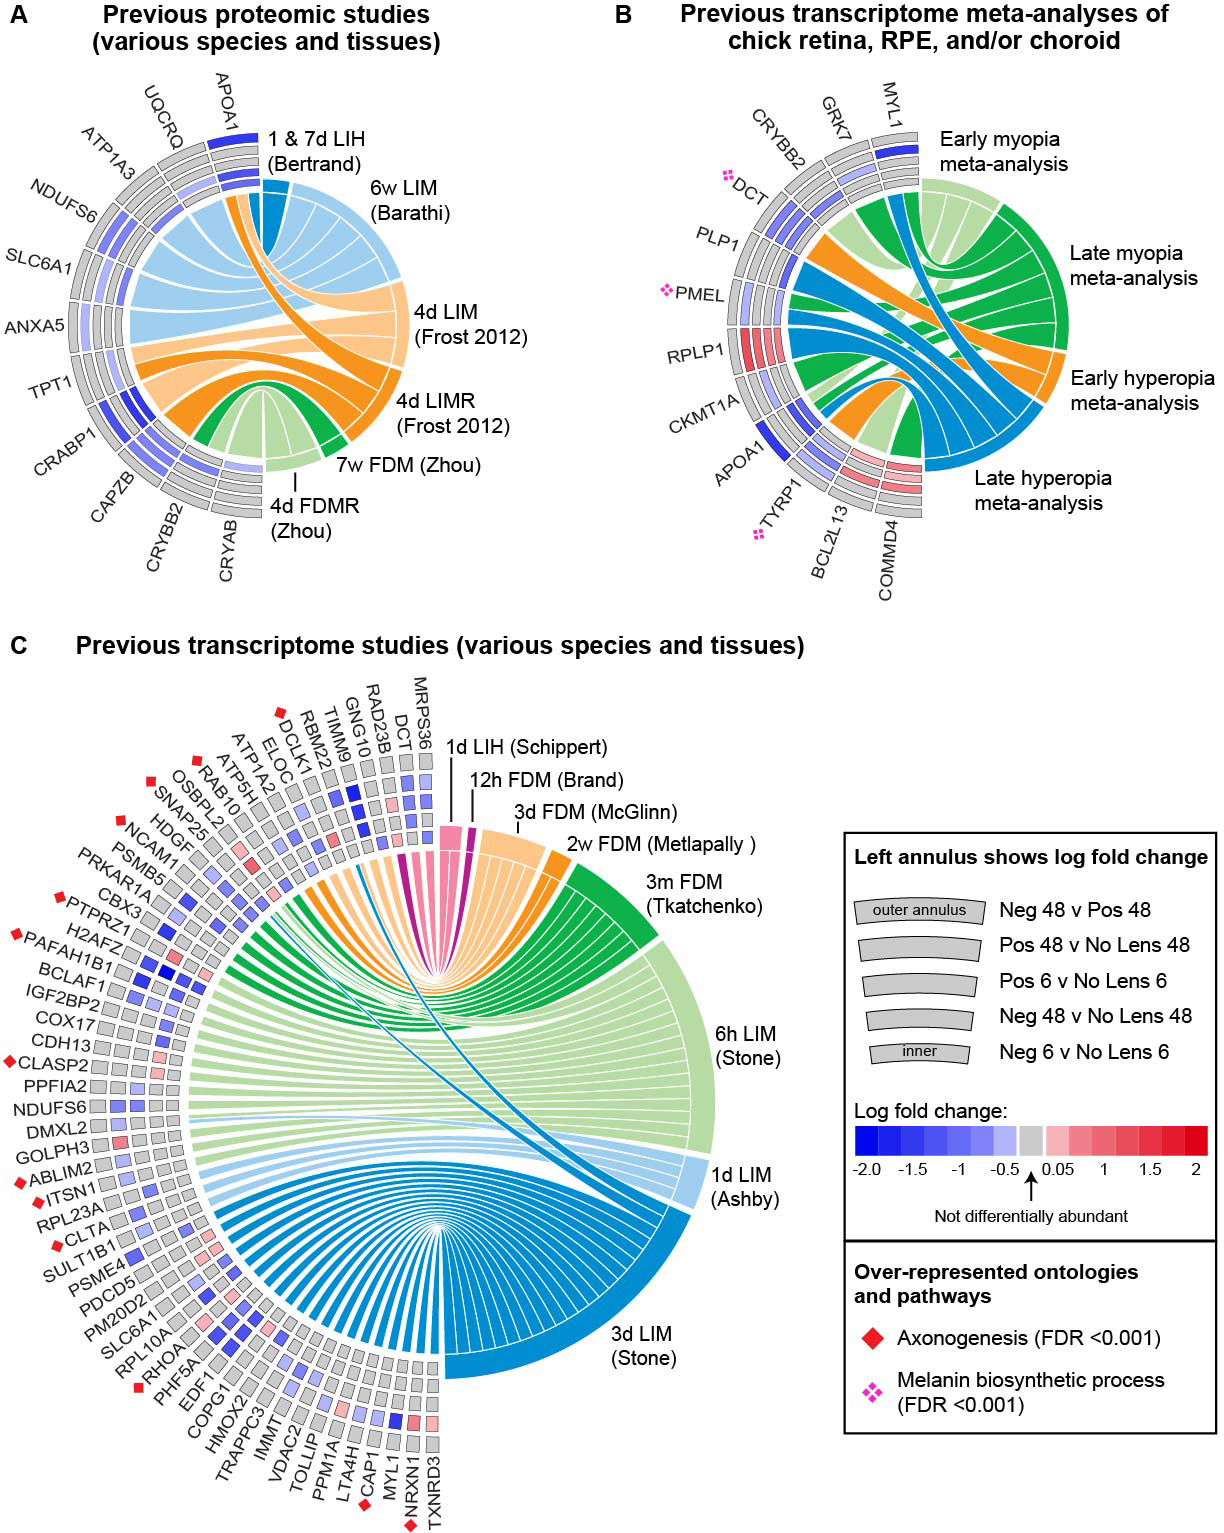
 Figure 3 of
Riddell, Mol Vis 2017; 23:872-888.
Figure 3 of
Riddell, Mol Vis 2017; 23:872-888.