Figure 2. Protein abundance changes across lens groups at 6 and 48 h. Venn diagrams show the overlap of differentially abundant proteins
in positive and negative lens groups relative to age-matched no lens controls at (A) 6 h and (B) 48 h. C: Heat map showing the label-free quantification (LFQ) intensity of individual samples for the 13 proteins that were differentially
abundant between the negative and positive lens groups at 48 h. Neg = negative lens, Pos = positive lens.
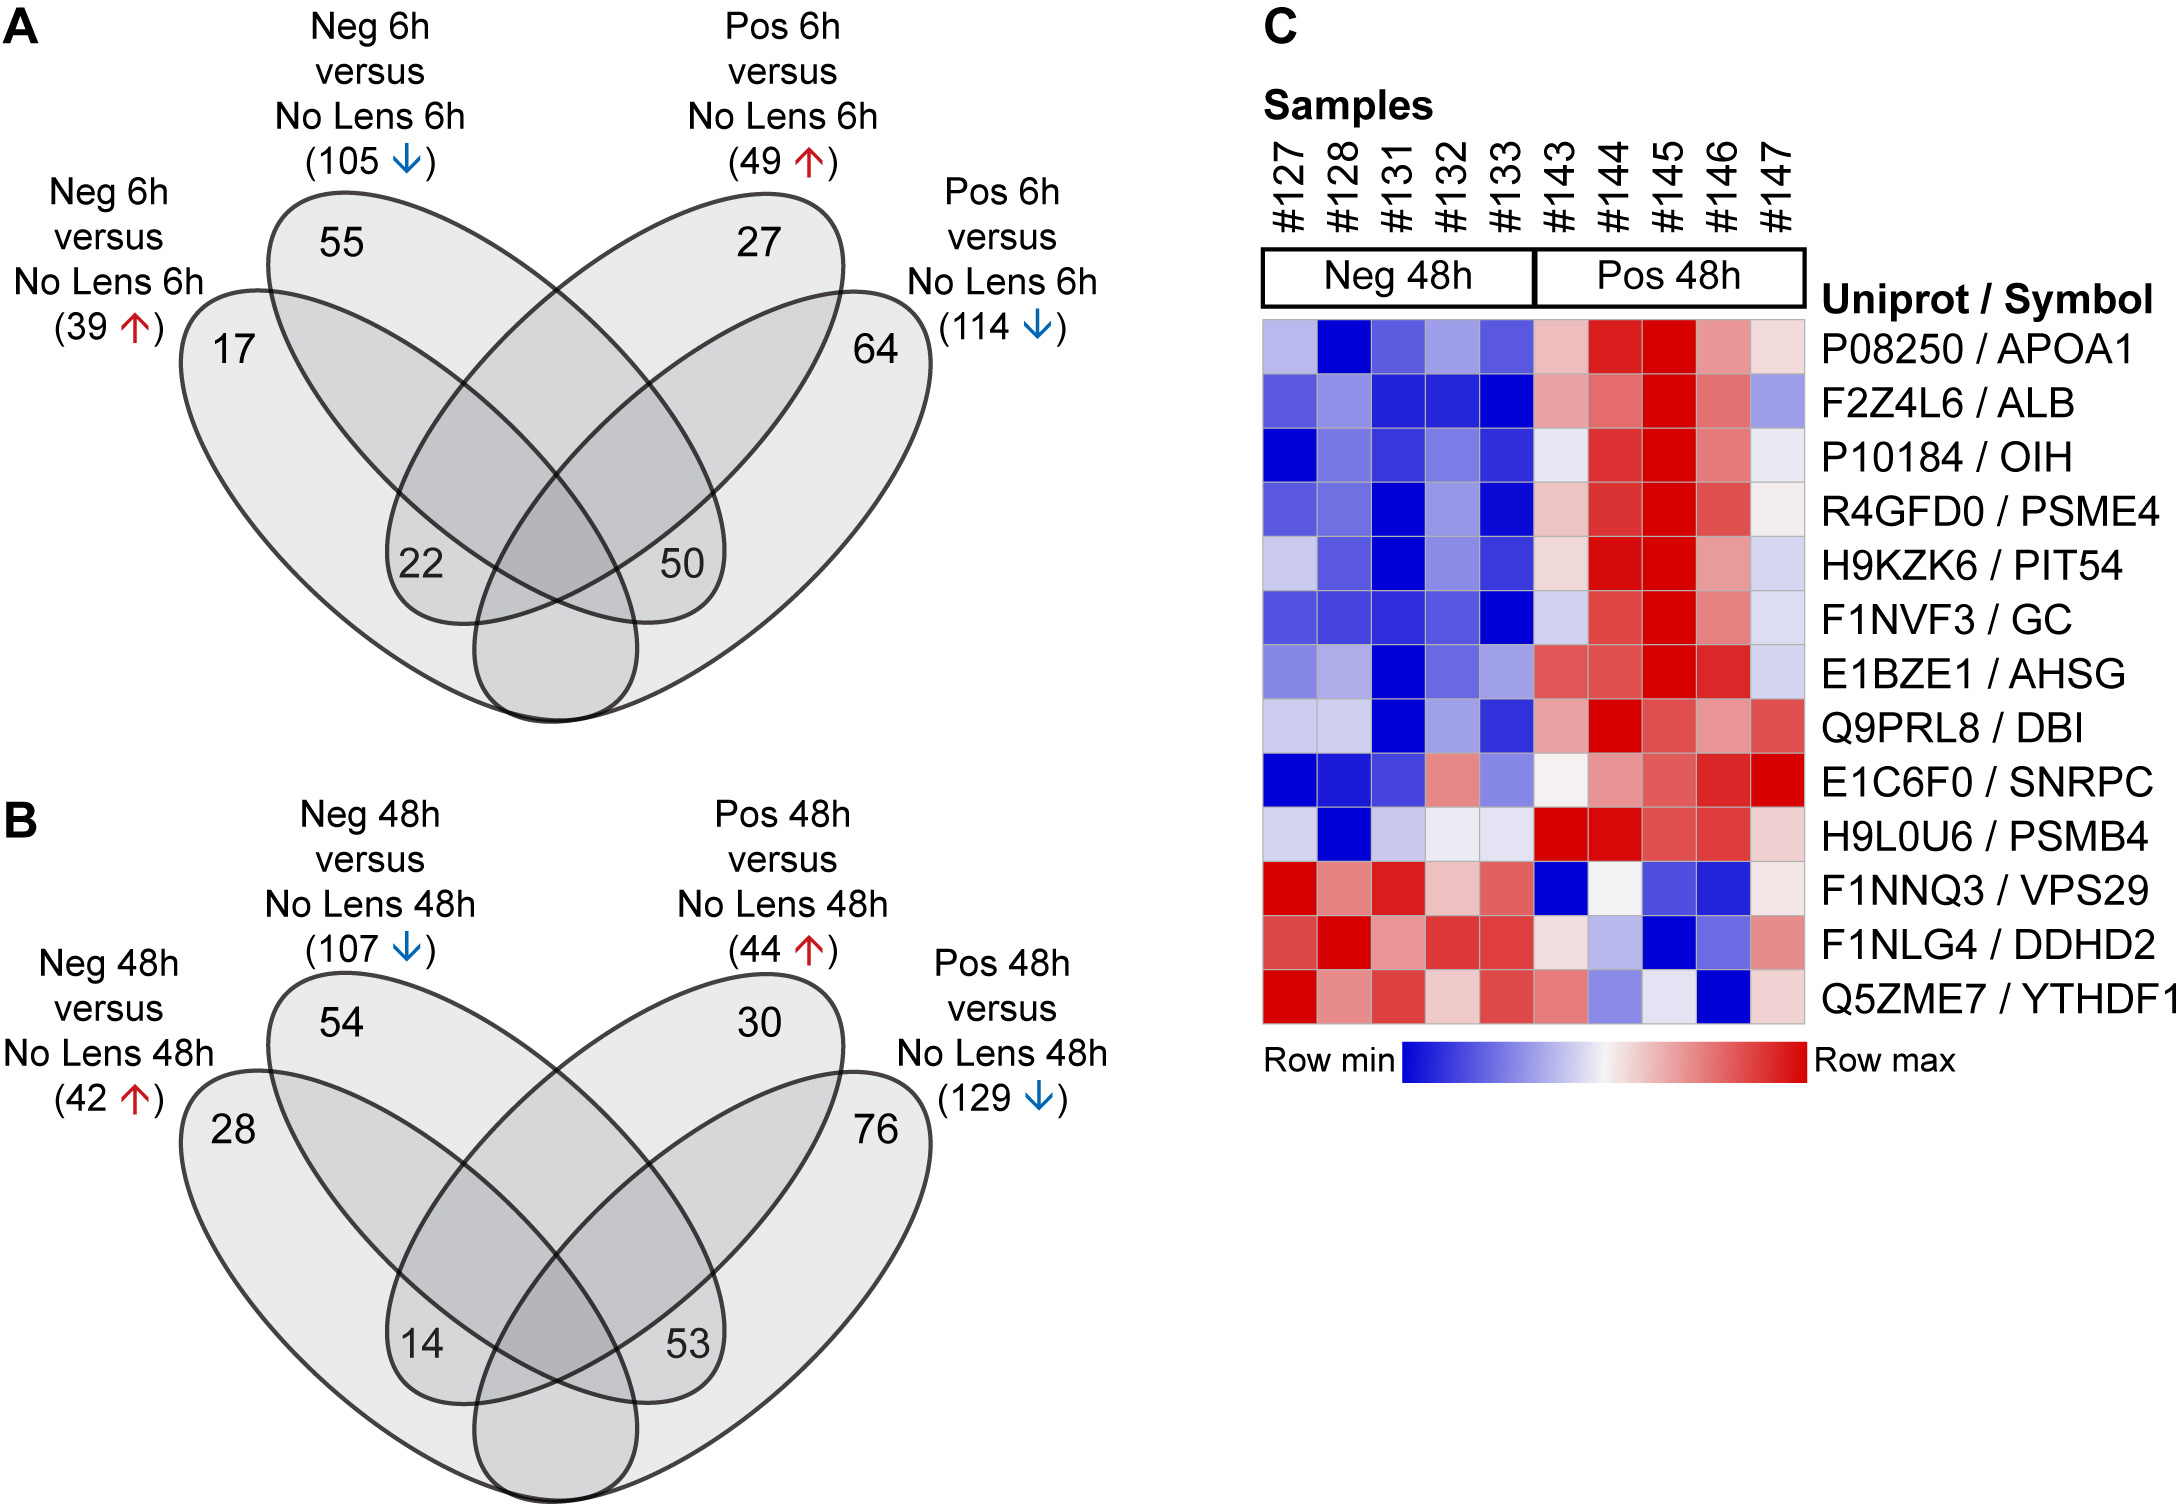
 Figure 2 of
Riddell, Mol Vis 2017; 23:872-888.
Figure 2 of
Riddell, Mol Vis 2017; 23:872-888.