Figure 1. Ocular biometry measurements. Column charts show the mean (± standard error, SE) right eye (A) refraction and (B) axial length following 6 and 48 h of lens-wear or no lens rearing. Mean vitreous chamber depth (± SE) is indicated at the
bottom of each axial length column. C: Scatter plots show the relationship between the refraction and ocular axial dimensions (the axial length and the vitreous
chamber depth). Neg = negative lens, Pos = positive lens.
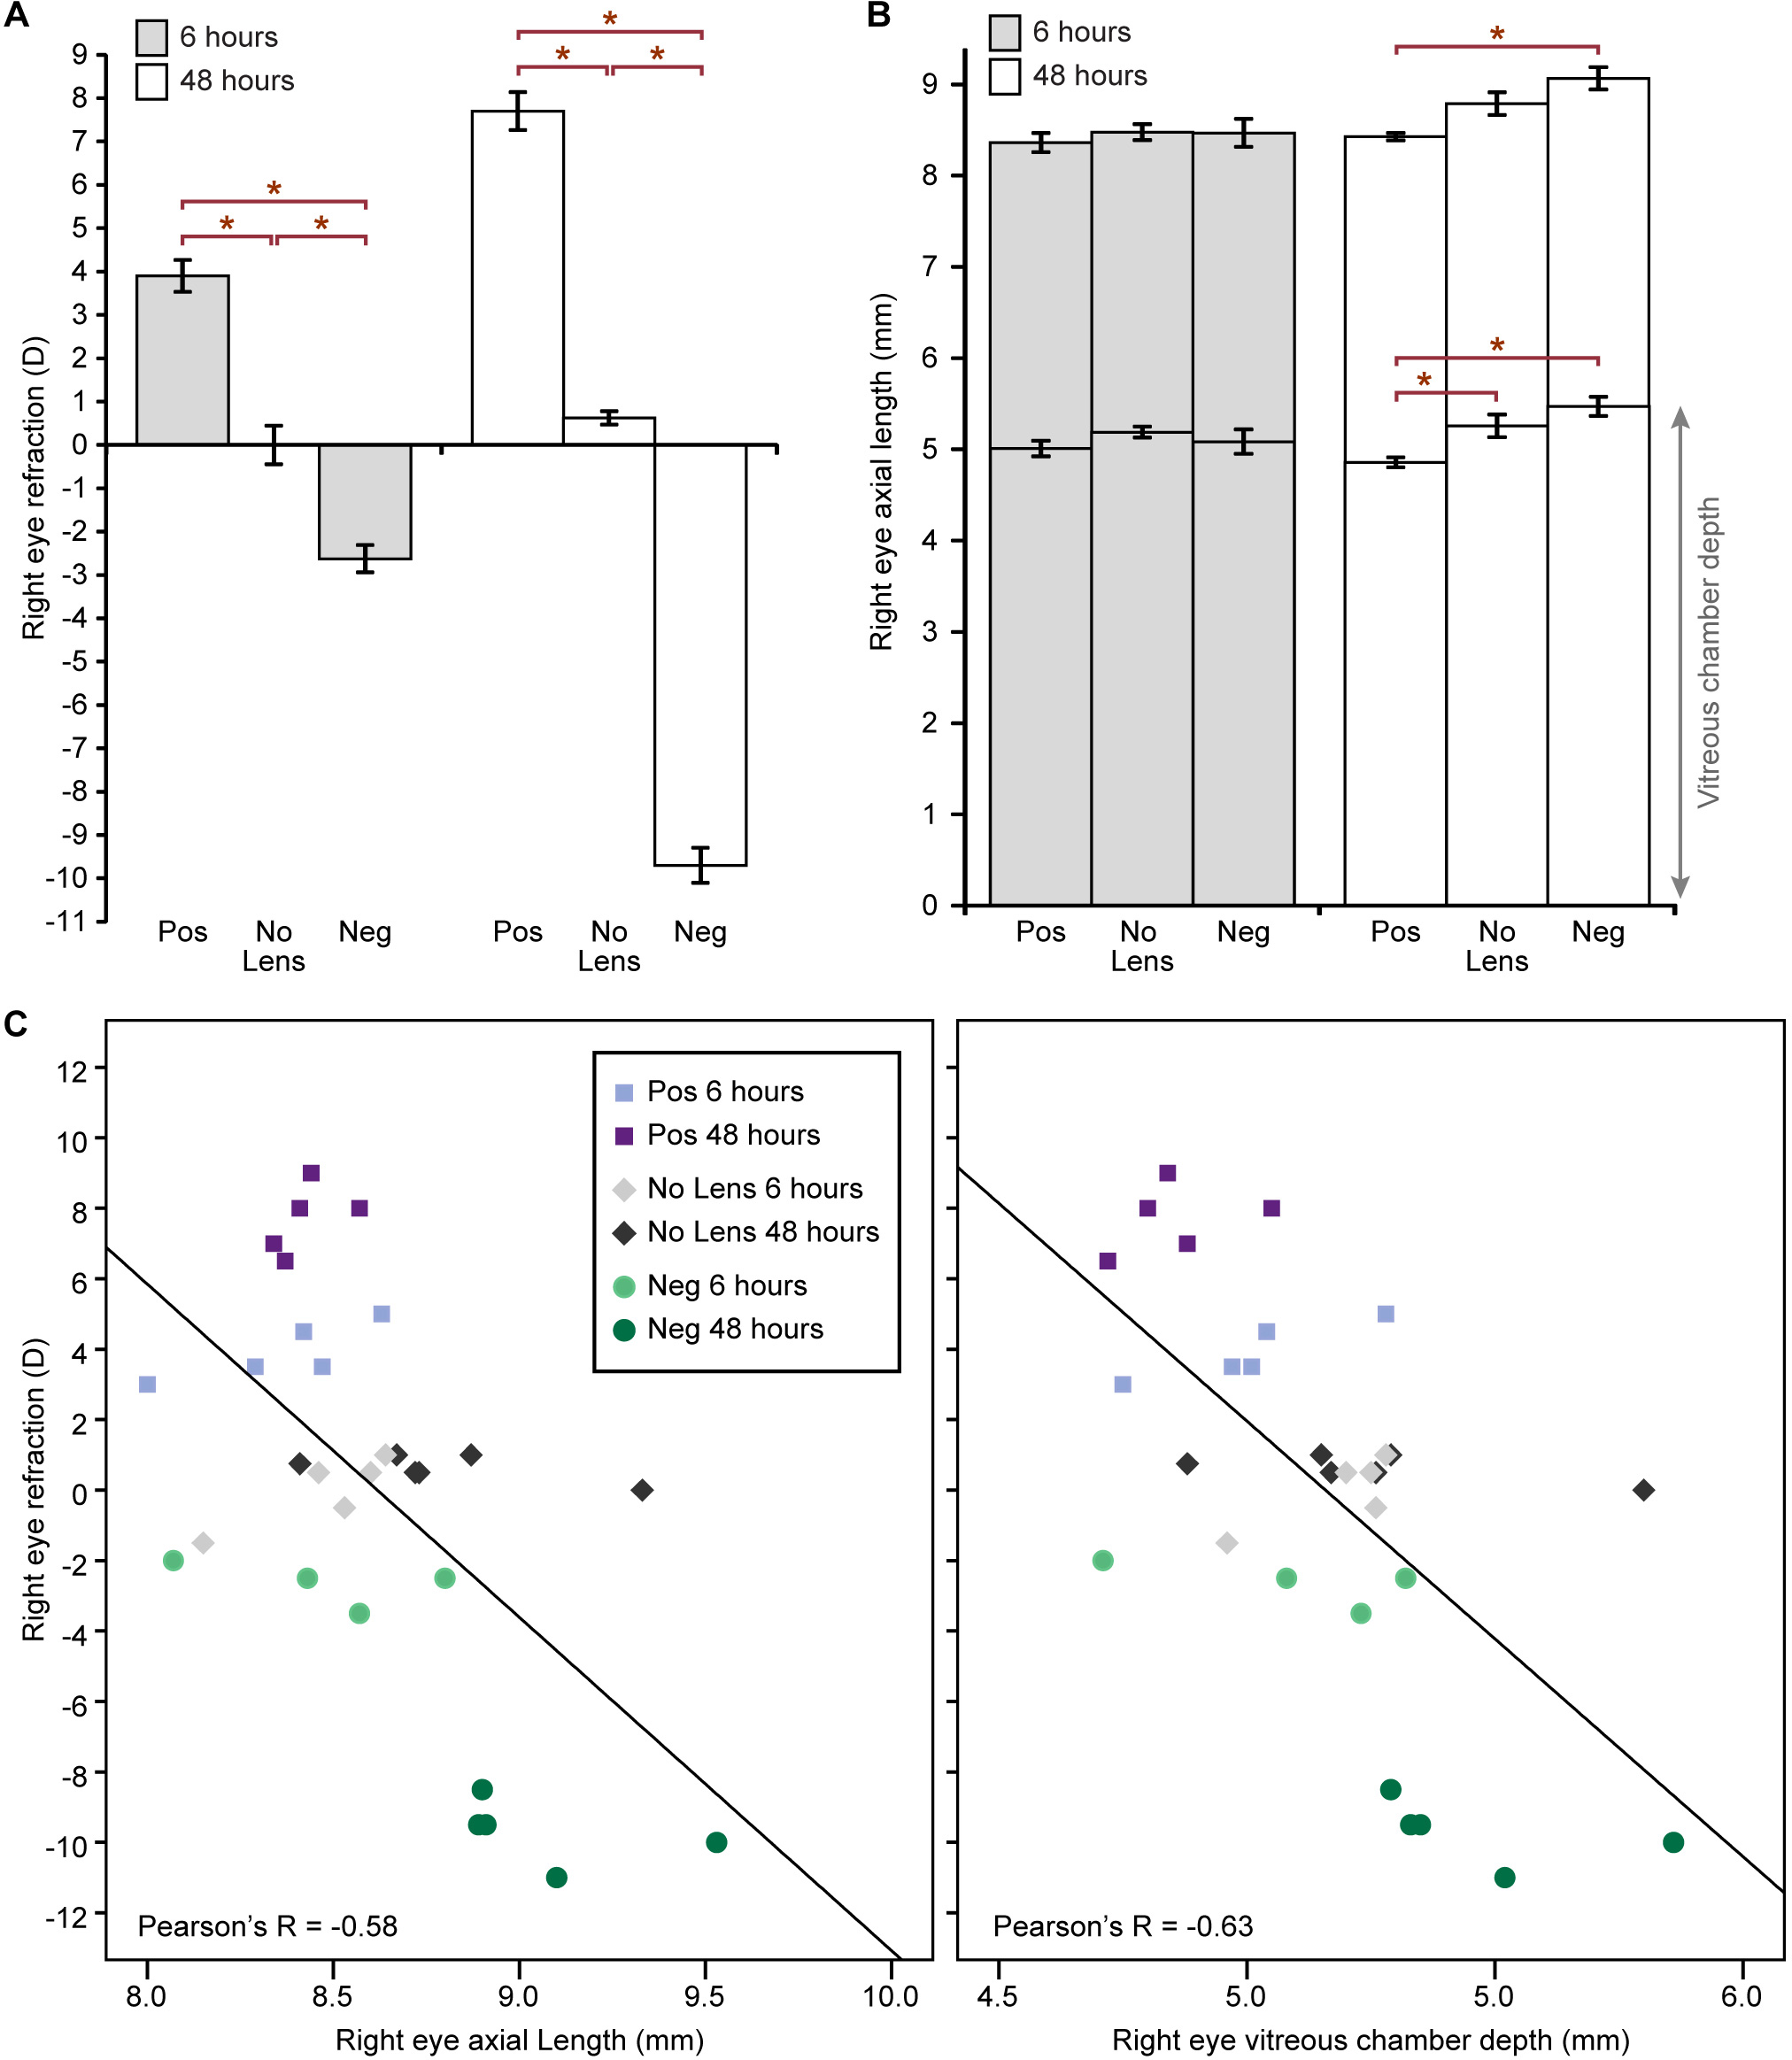
 Figure 1 of
Riddell, Mol Vis 2017; 23:872-888.
Figure 1 of
Riddell, Mol Vis 2017; 23:872-888.