Figure 5. Expression of vascular adhesion protein-1 (VAP-1) in human retinas. A: mRNA was analyzed by real-time quantitative RT–PCR in the RPE and neuroretina (NR). The VAP-1 mRNA expression was calculated
after normalizing for β-actin mRNA levels. Bars represent the mean ± SD of the R.Q. values obtained for the mRNA levels in
diabetic (D; n = 16) and non-diabetic control donors (C; n = 16). *p<0.05 (Mann–Whitney U test). B: The VAP-1 protein expression was determined by western blot analysis on lysates of the RPE and NR from representative diabetic
(D; n = 4) and non-diabetic control (C; n = 4) donors. The ratios of band intensities of the VAP-1 protein versus actin were determined in all samples (n = 16/group).
Data are expressed as the mean ± SD *p<0.05 (Mann–Whitney U test).
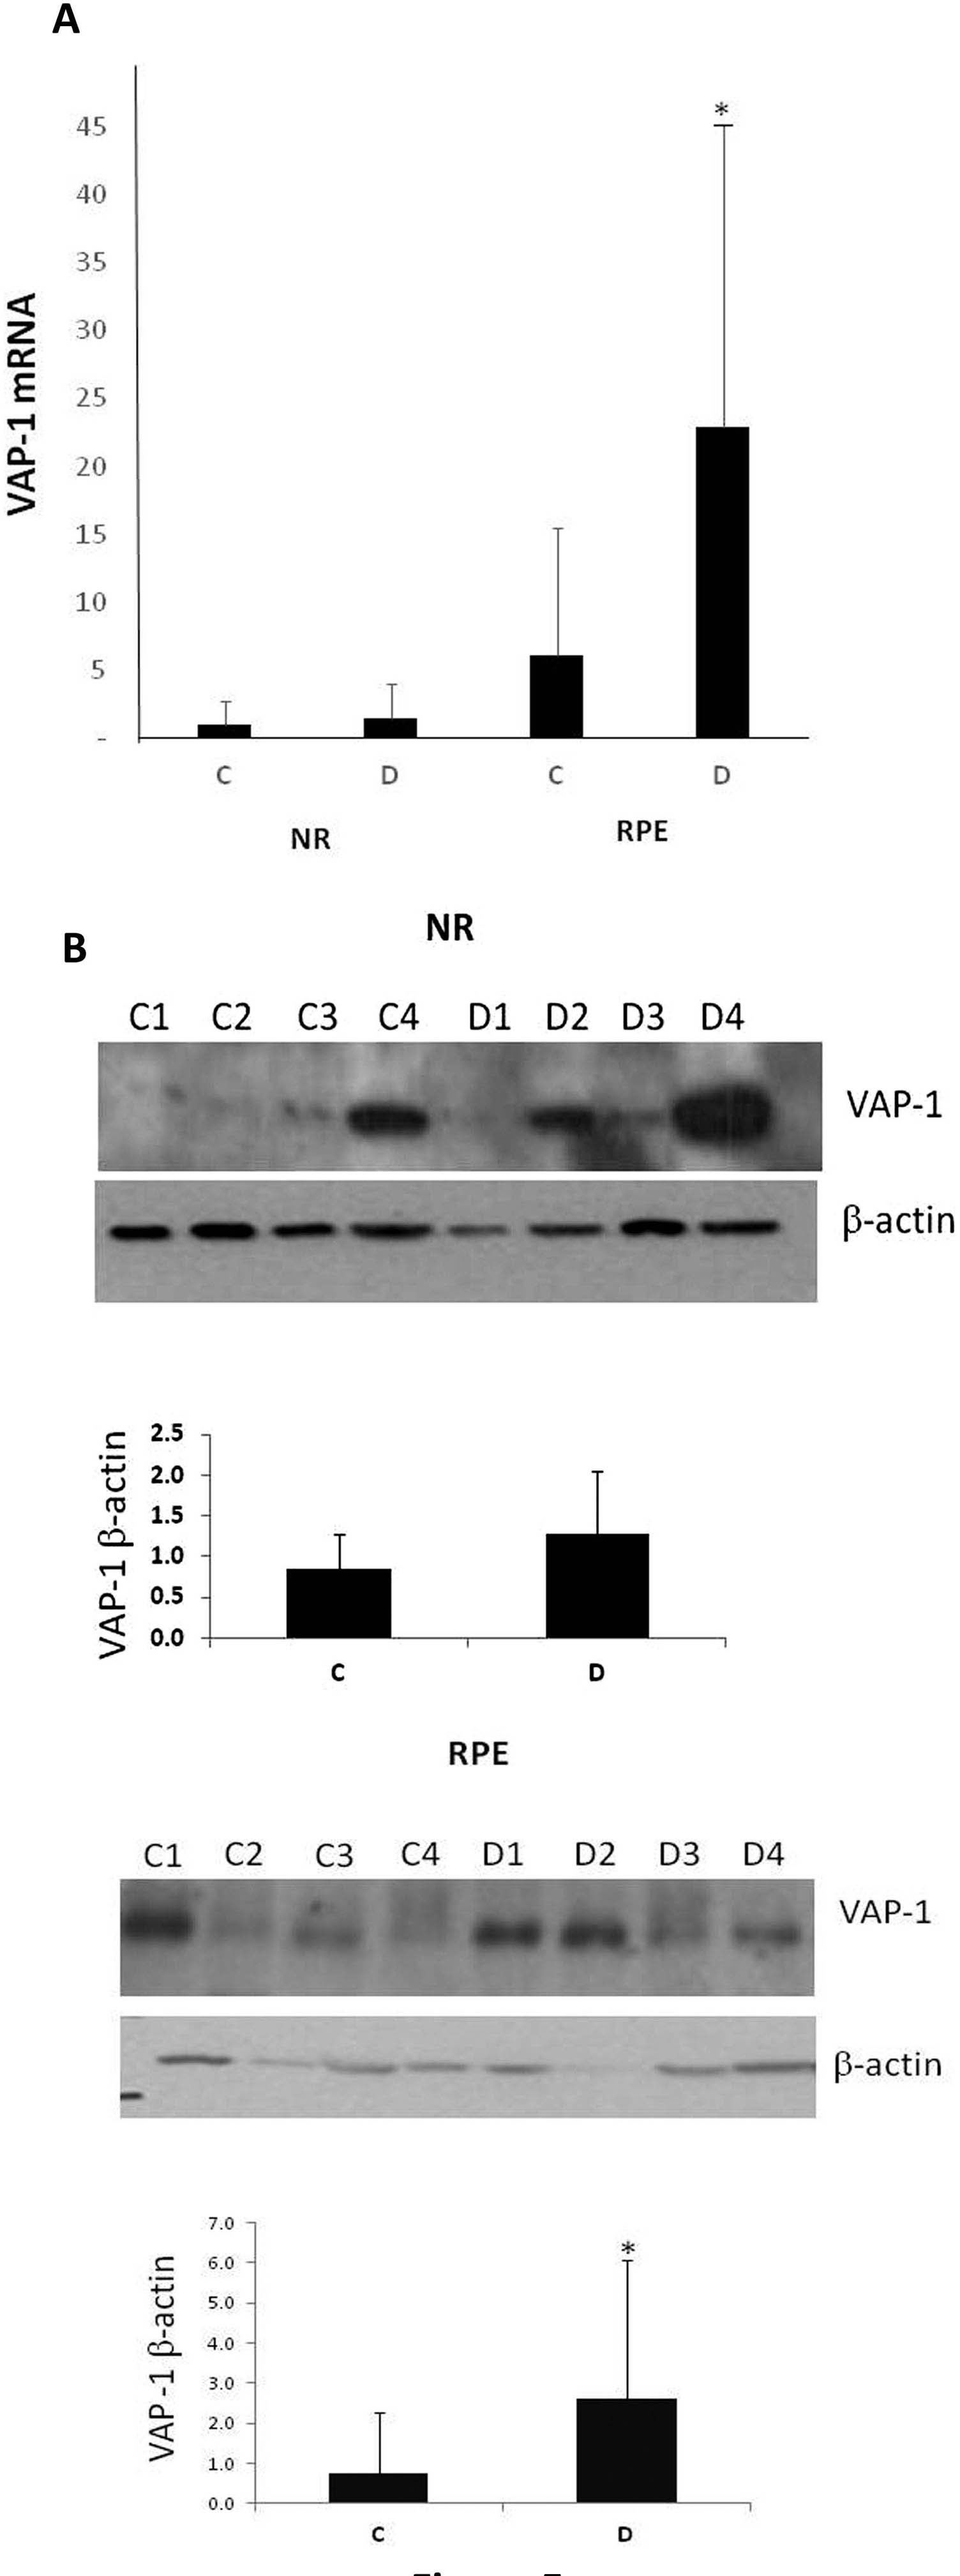
 Figure 5 of
Abu El-Asrar, Mol Vis 2017; 23:853-871.
Figure 5 of
Abu El-Asrar, Mol Vis 2017; 23:853-871.