Figure 1. MEL receptor type 1 (MT1) and melatonin receptor type 2 (MT2) in 661W cells. The top left panel shows MT1 and MT2 RNA expression. Ladder=100 bp. MT1 and MT2 immunoreactivity (green) was detected in 661W cells. Secondary antibody control without a primary antibody (the bottom left
panel) and absorption control using a blocking peptide (the bottom center and right panels) were performed. Cell nuclei are
shown in red. Scale bar=100 µm.
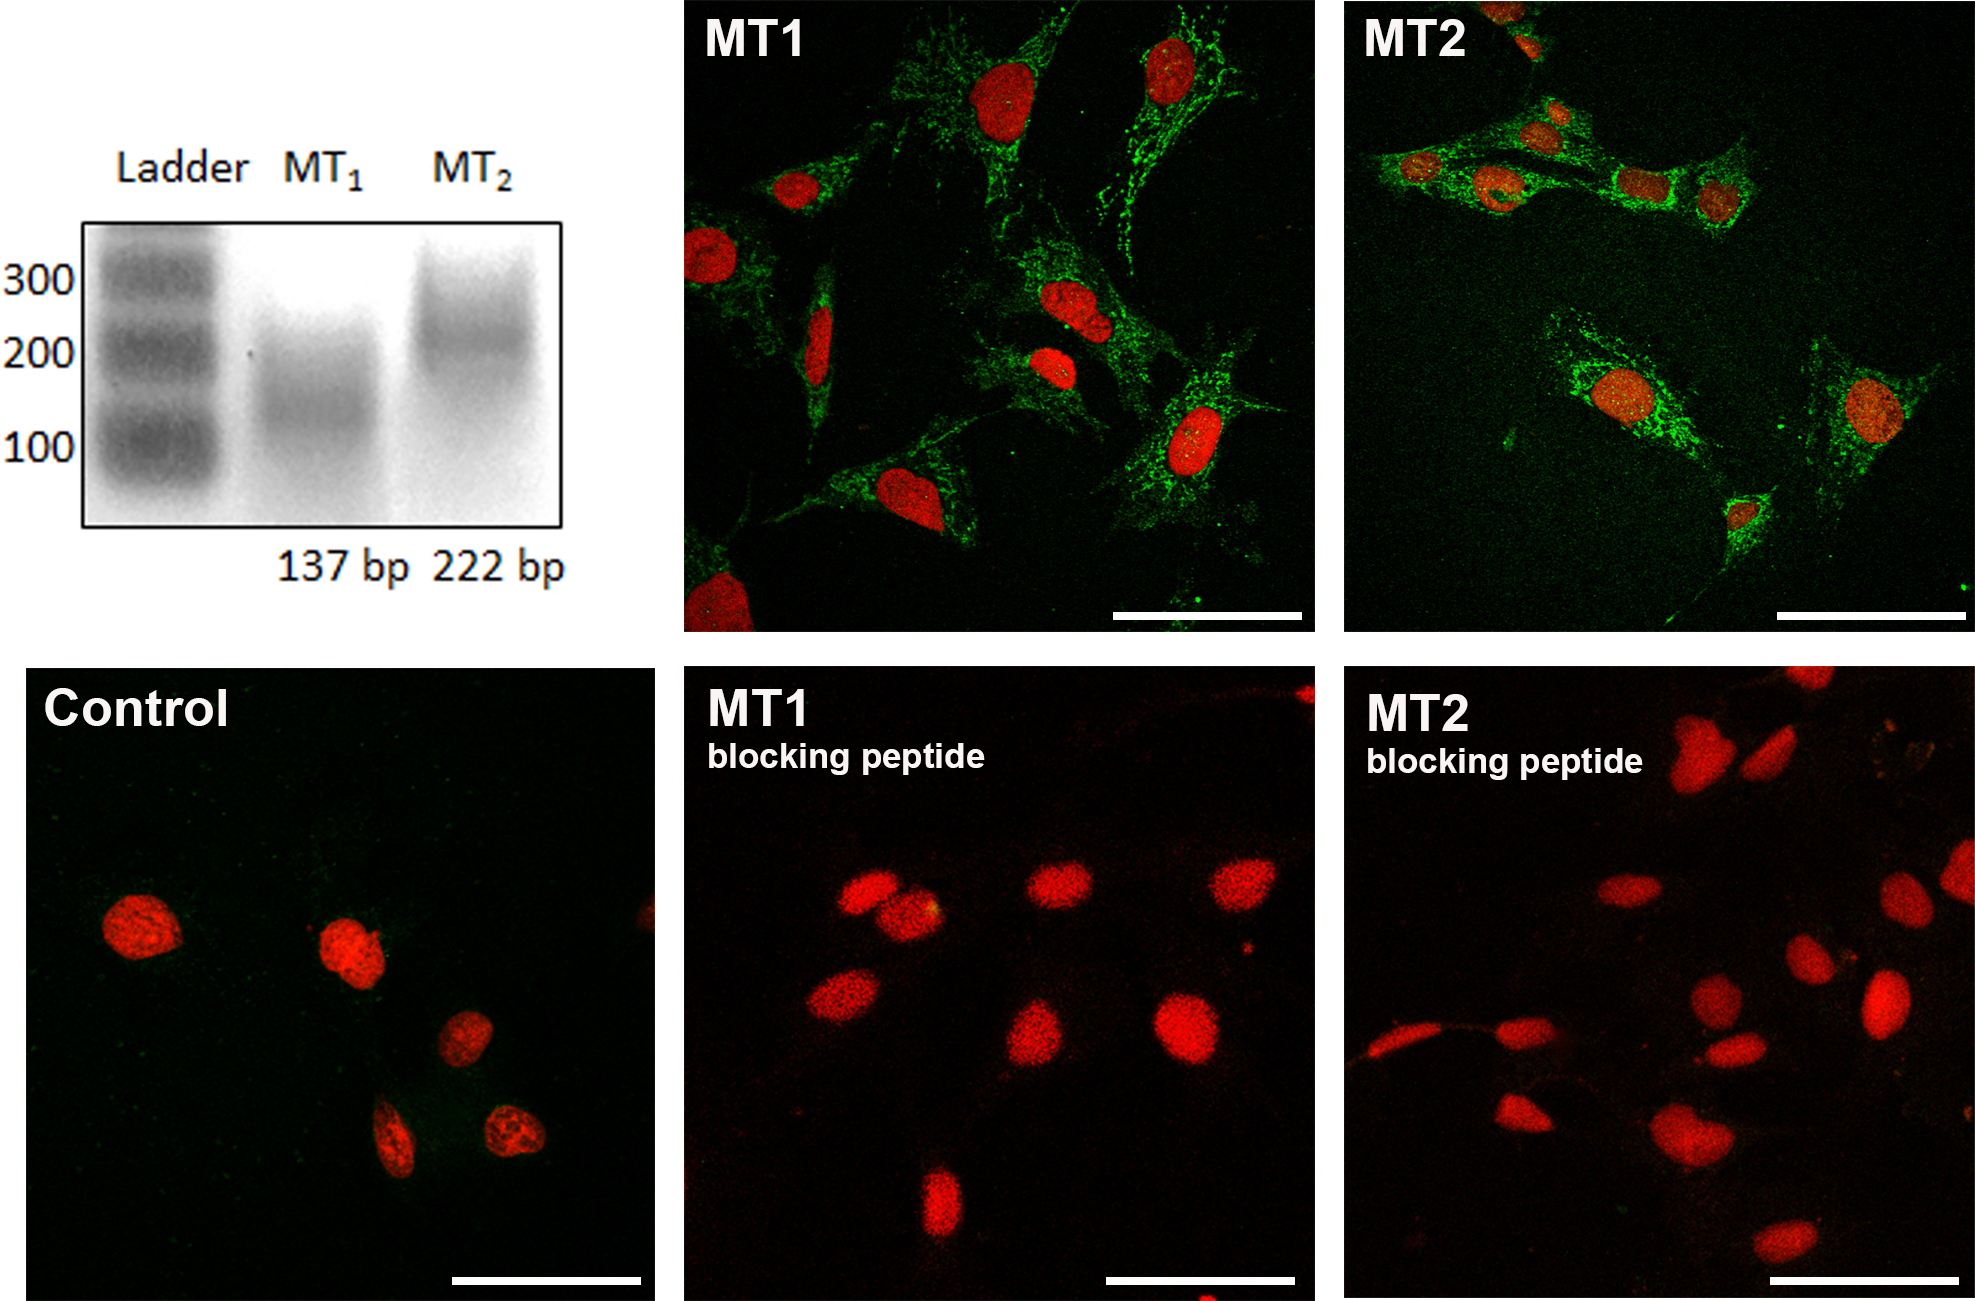
 Figure 1 of
Sánchez-Bretaño, Mol Vis 2017; 23:844-852.
Figure 1 of
Sánchez-Bretaño, Mol Vis 2017; 23:844-852.