Figure 7. Reduced a-wave in focal ERGs in the central retina of pilot- and sPBS-treated eyes compared to untreated eyes. A: Representative recordings of scotopic focal electroretinograms (ERGs) in the untreated and pilot- and subretinal PBS injection
(sPBS)-treated eyes. B: The amplitudes of the scotopic a- and b-waves in the pilot- (**p<0.01, n=10) and sPBS-treated eyes (†††p<0.001, n=8) were
statistically significantly reduced compared to those in the untreated eyes (n=9). Note that a- amplitude is usually negative
but is recorded as a positive absolute value for ease in comparison.
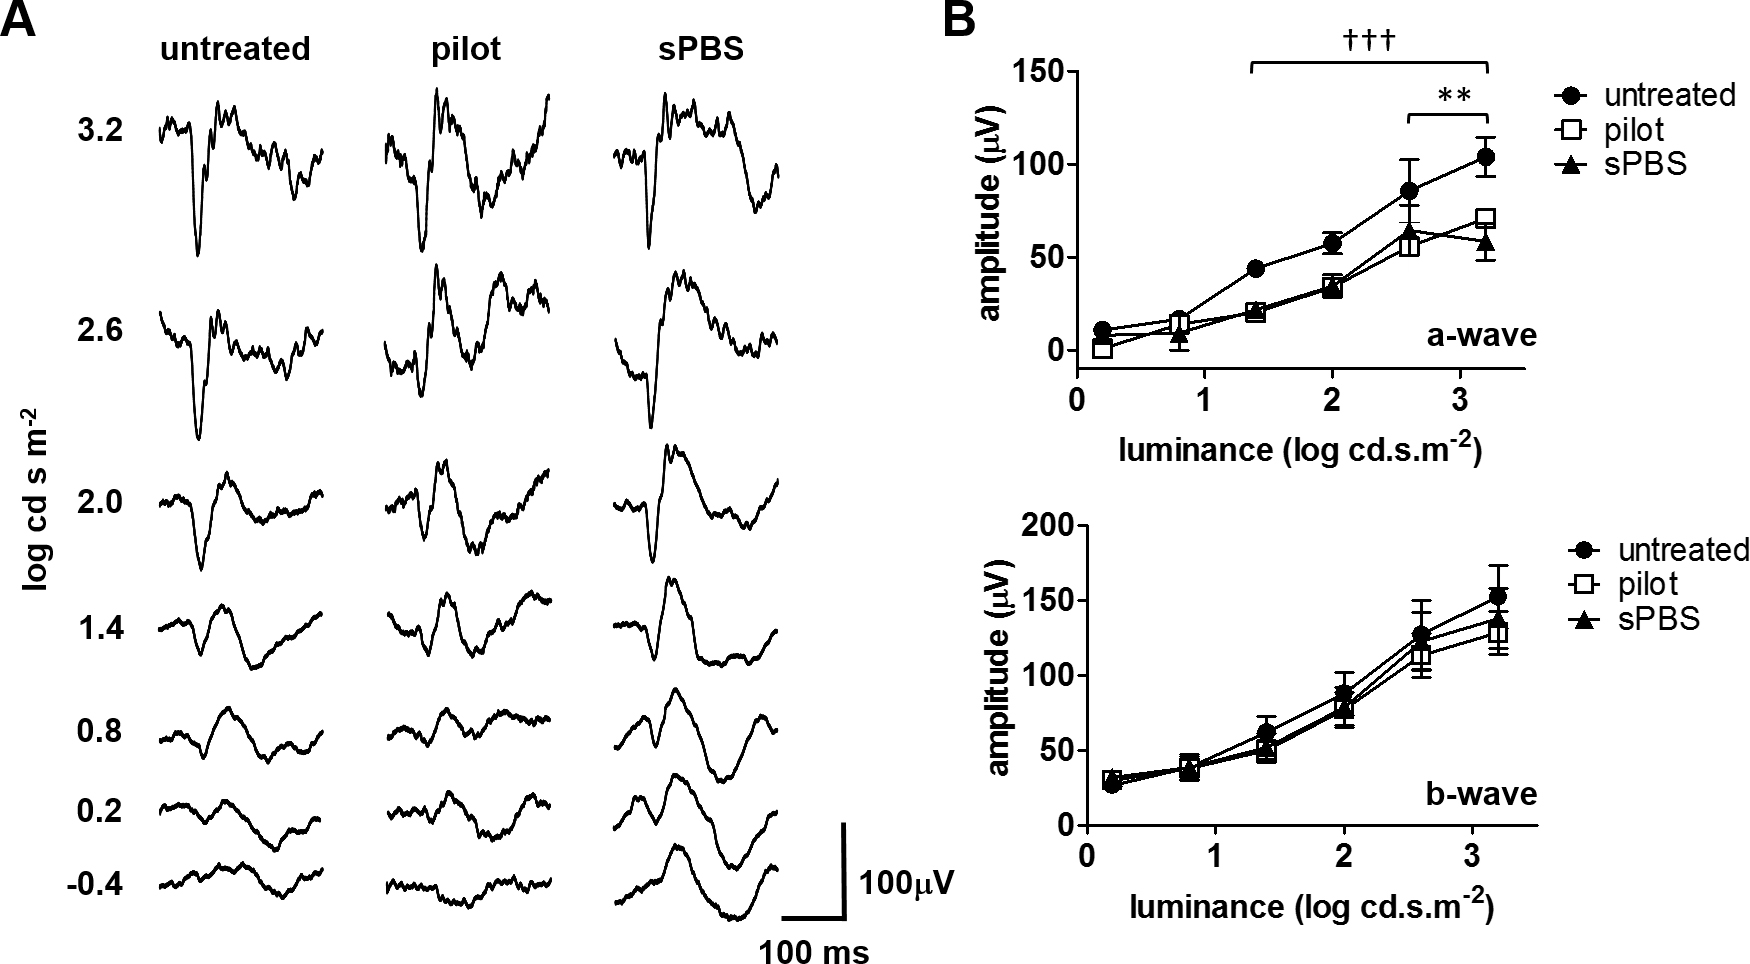
 Figure 7 of
Becker, Mol Vis 2017; 23:832-843.
Figure 7 of
Becker, Mol Vis 2017; 23:832-843.