Figure 3. Increased areas of avascular retina and intravitreal neovascularization in pilot- and sPBS-treated compared to untreated eyes.
A: Representative images of retinal flat mounts at P32 from the untreated and pilot- and subretinal PBS injection (sPBS)-treated
eyes. B: Quantification of the avascular area (AVA) and C: the intravitreal neovascular/total retinal area (IVNV) in each group. The AVA was statistically significantly increased
in the pilot- (*p<0.05, n=9) and sPBS-treated (sPBS, **p<0.01, n=9) eyes compared to the untreated eyes (n=9) and in the sPBS-treated
eyes compared to the pilot-treated eyes (**p<0.01). The IVNV was increased in the sPBS-treated eyes compared to the untreated
eyes (**p<0.01).
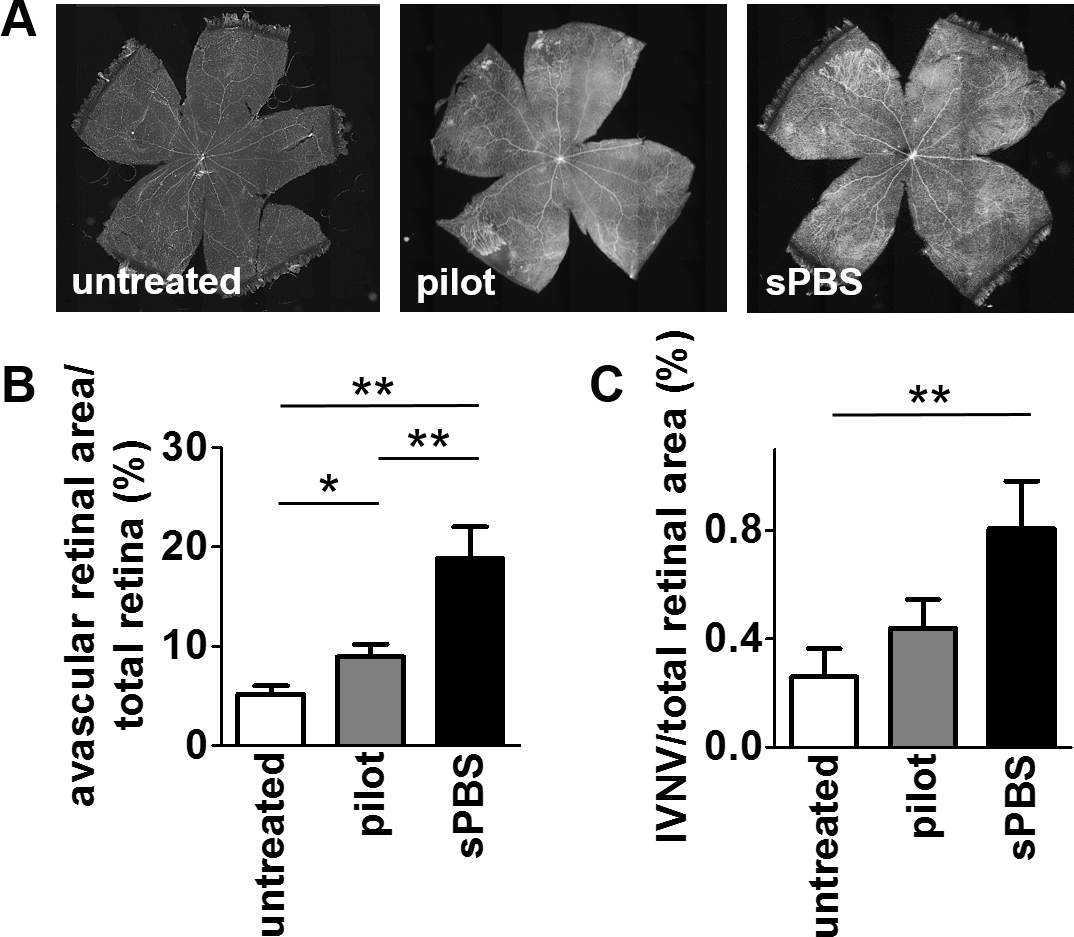
 Figure 3 of
Becker, Mol Vis 2017; 23:832-843.
Figure 3 of
Becker, Mol Vis 2017; 23:832-843.