Figure 1. Experimental design and ERG analysis. A: Within 6 h of birth, litters of 12–16 rat pups with the dams were exposed to oxygen fluctuations between 50% and 10% O2 every 24 h. At the beginning of the 50% cycle on postnatal day (P) 8, eyes were treated with subretinal PBS injection (sPBS-treated),
pilot injection (pilot-treated), or eyelid opening and light exposure (light-treated), or the animals were left untreated
and were returned to oxygen cycling. The animals remained in room air from P14, and some had one or more of the following
procedures: retinal imaging on P26, focal electroretinogram (ERG) on P28 or P29 for respective eyes, optical coherence tomography
(OCT) on both eyes on P30 and Ganzfeld ERG on P31 or P32 for the respective eyes, and tissue harvest on P32. B: The amplitude of the a-wave was measured from the baseline, the latency from the light stimulus to the trough of the negative
going a-wave. The amplitude of the b-wave was determined from the trough of the a-wave to the peak of the b-wave, the latency
from the light stimulus to the peak of the b-wave.
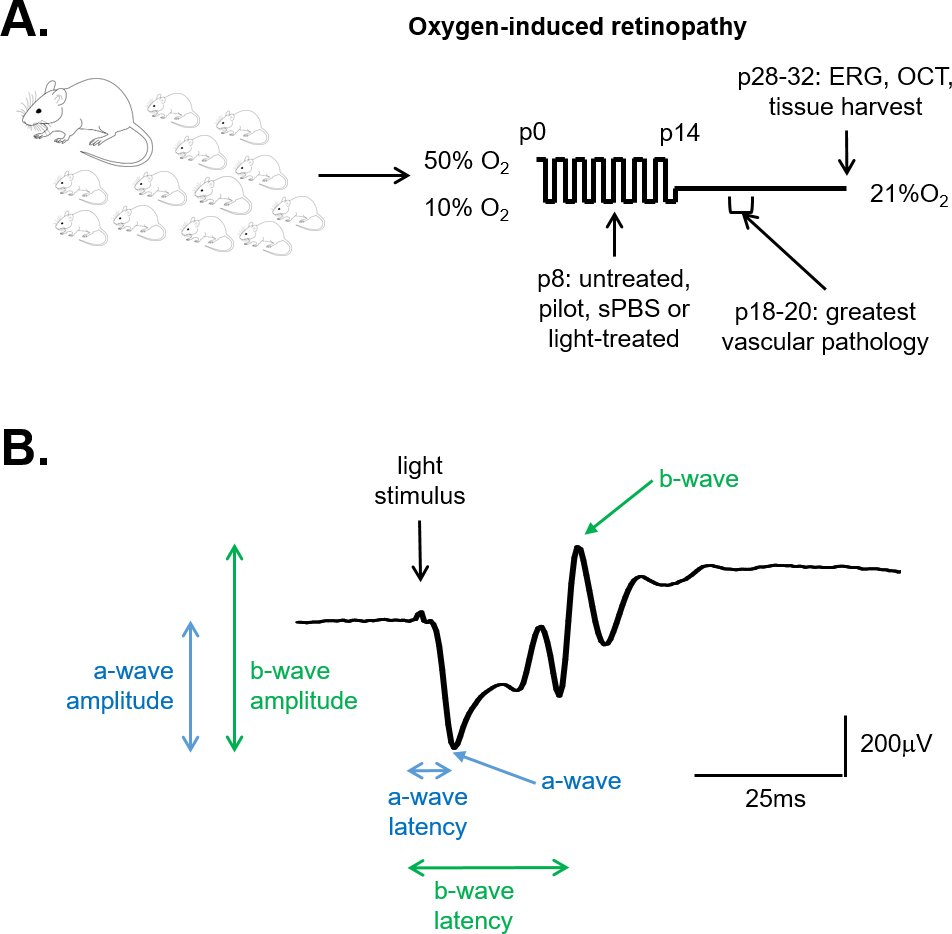
 Figure 1 of
Becker, Mol Vis 2017; 23:832-843.
Figure 1 of
Becker, Mol Vis 2017; 23:832-843.