Figure 6 of
Man, Mol Vis 2017; 23:810-822.
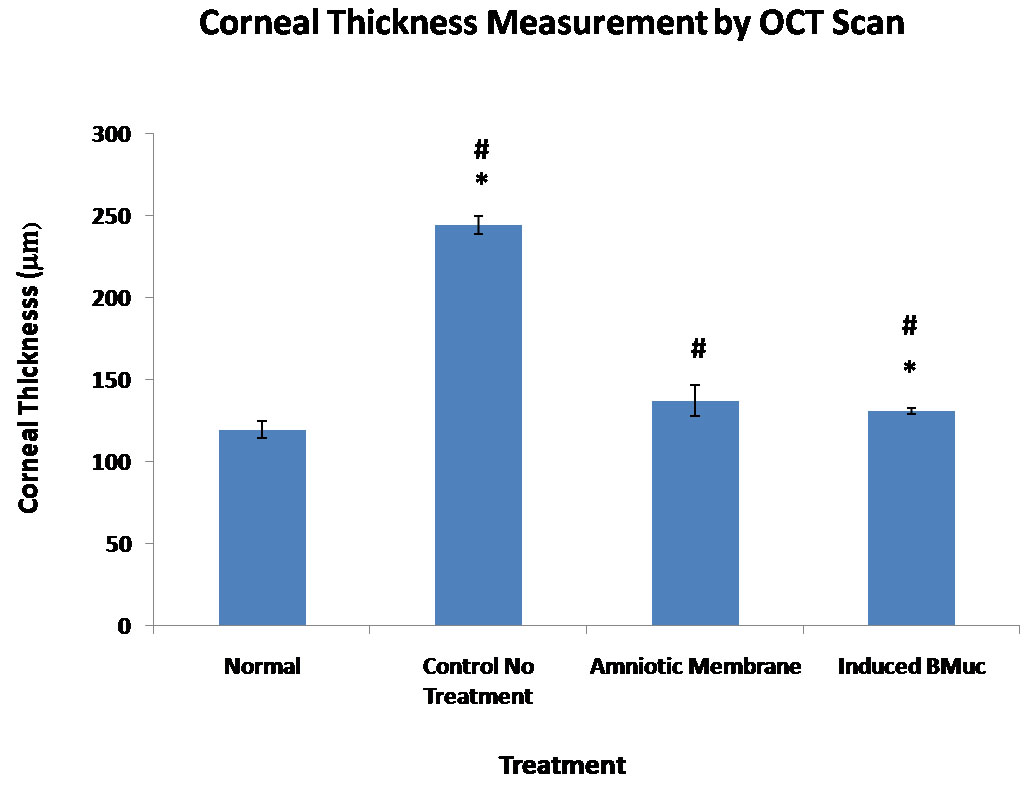
Figure 6.
Corneal thickness measurement by optical coherence tomography (OCT) scan at 8 weeks post implantation.* Normal cornea compared to NT and TEC (p<0.05). # NT compared to AM and TEC (p<0.05).
 Figure 6 of
Man, Mol Vis 2017; 23:810-822.
Figure 6 of
Man, Mol Vis 2017; 23:810-822.