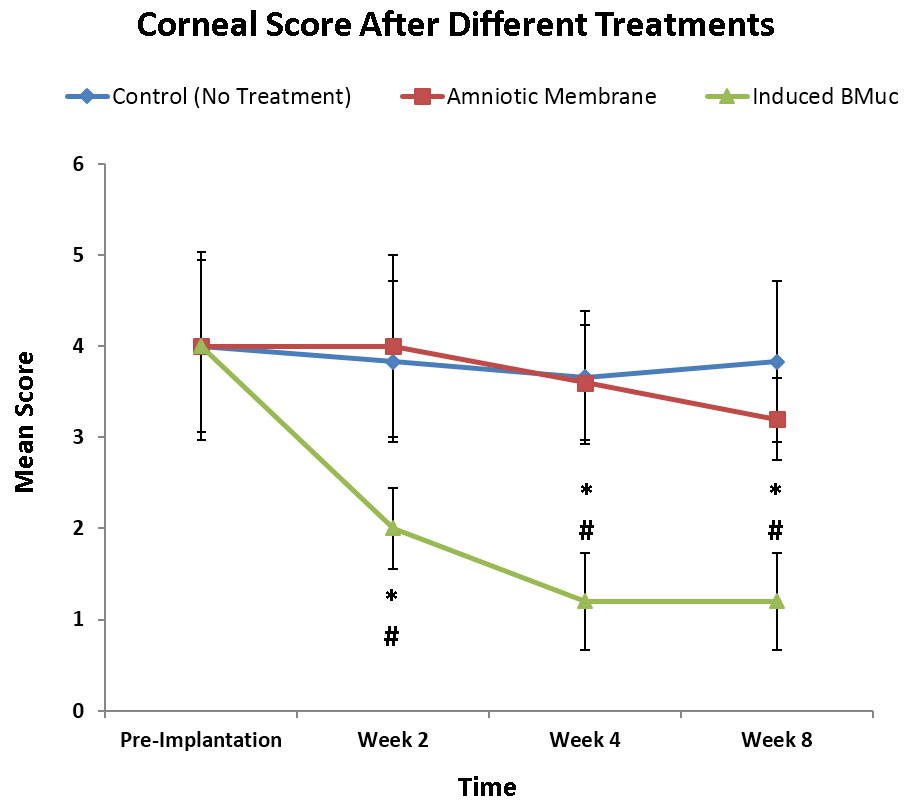
Figure 5. Corneal scoring after different treatments at pre-implantation and at Week 2, Week 4, and Week 8 after implantation based
on the corneal grading in
Table 2. * TEC compared to NT at Week 2, Week 4, and Week 8 (p<0.05). # TEC compared to AM at Week 2, Week 4, and Week 8 (p<0.05).
 Figure 5 of
Man, Mol Vis 2017; 23:810-822.
Figure 5 of
Man, Mol Vis 2017; 23:810-822.