Figure 3. Immunocytochemical analysis using CK3 and p63 antibodies in corneal epithelial cells from native human corneal ring samples;
uninduced BMuc and induced BMuc after 10 d of induction (magnification: 100x). The blue color represents the 4', 6-diamidino-2-phenylindole
(DAPI) stain in cell nuclei, and the green color represents the fluorescein isothiocyanate (FITC) stain, either in nuclei
or cytoplasm. The percentage of positive stains in three different groups was also measured. *Induced BMuc compared to uninduced BMuc for CK3 (p<0.05). #Induced BMuc compared to uninduced BMuc for p63 (p<0.05). ND: not
detected.
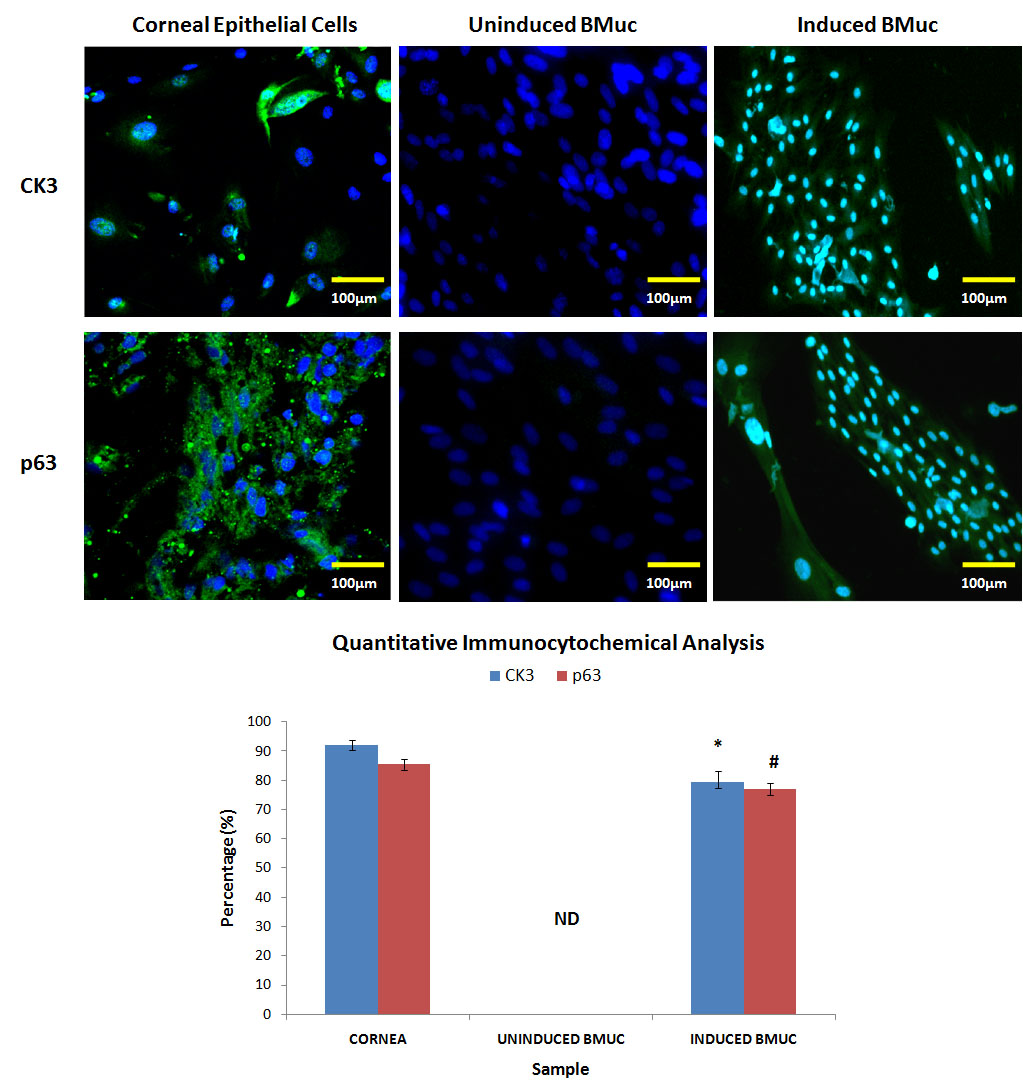
 Figure 3 of
Man, Mol Vis 2017; 23:810-822.
Figure 3 of
Man, Mol Vis 2017; 23:810-822.