Figure 2. Western blot analysis of Mertk protein expression in different passages of RPE cells and BM-MSCs. A: Upper panel, Mertk protein expression. Lower panel, protein samples assayed for β-actin expression, control for protein
loading. B: Quantification of Mertk protein expression. The sampling size for each group is 3.The error bars are standard deviation
(SD). The data were analyzed with one-way ANOVA. Mertk protein expression in RPE P0 was significantly greater than in RPE
P1. Mertk protein expression in MSC P0 was lower than MSC P1. Mertk protein expression in MSC P1 and P2 was significant greater
than RPE.
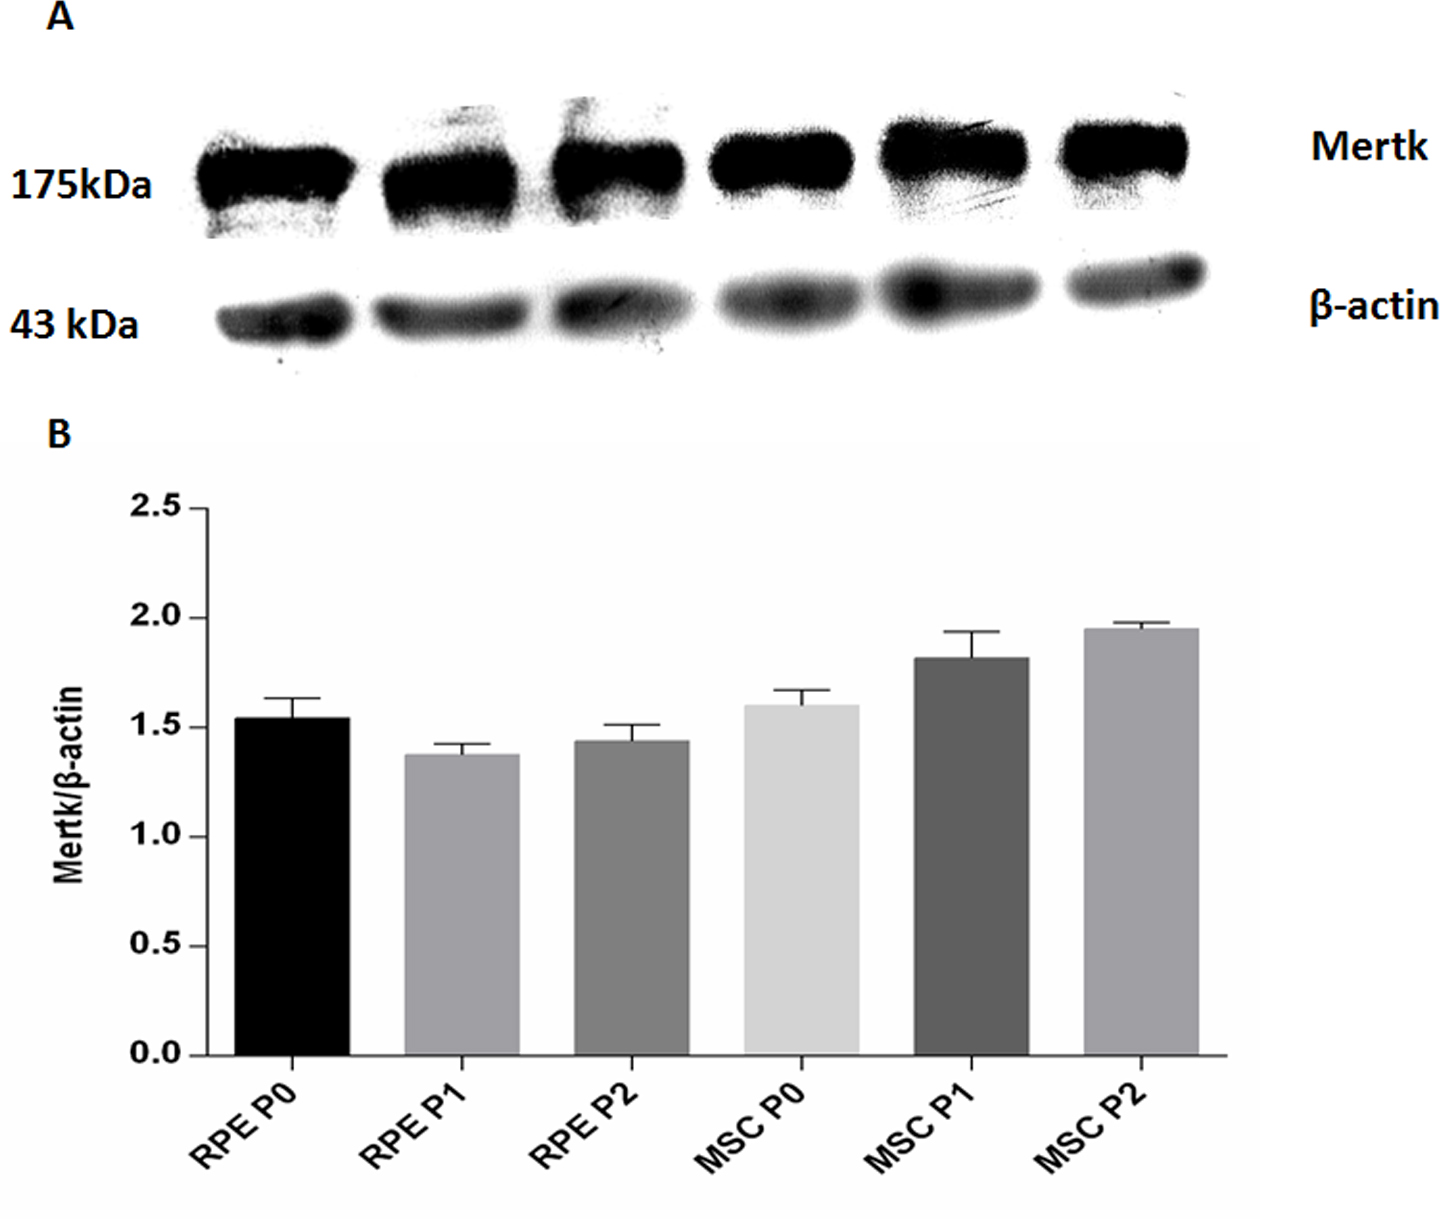
 Figure 2 of
Peng, Mol Vis 2017; 23:8-19.
Figure 2 of
Peng, Mol Vis 2017; 23:8-19.